


signal strength 1 of 5
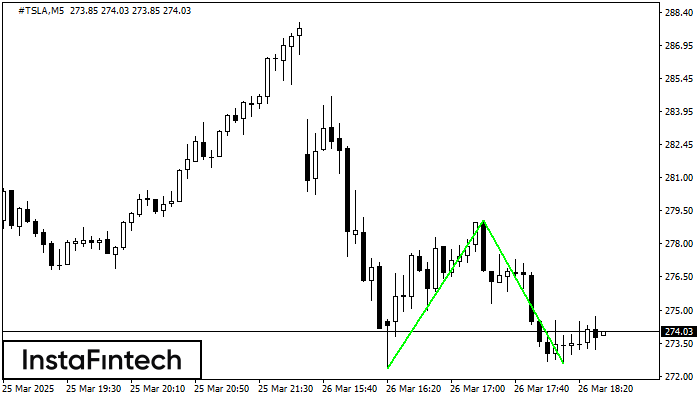
The Double Bottom pattern has been formed on #TSLA M5. Characteristics: the support level 272.37; the resistance level 279.03; the width of the pattern 666 points. If the resistance level is broken, a change in the trend can be predicted with the first target point lying at the distance of 645 points.
The M5 and M15 time frames may have more false entry points.
Veja também
- All
- Double Top
- Flag
- Head and Shoulders
- Pennant
- Rectangle
- Triangle
- Triple top
- All
- #AAPL
- #AMZN
- #Bitcoin
- #EBAY
- #FB
- #GOOG
- #INTC
- #KO
- #MA
- #MCD
- #MSFT
- #NTDOY
- #PEP
- #TSLA
- #TWTR
- AUDCAD
- AUDCHF
- AUDJPY
- AUDUSD
- EURCAD
- EURCHF
- EURGBP
- EURJPY
- EURNZD
- EURRUB
- EURUSD
- GBPAUD
- GBPCHF
- GBPJPY
- GBPUSD
- GOLD
- NZDCAD
- NZDCHF
- NZDJPY
- NZDUSD
- SILVER
- USDCAD
- USDCHF
- USDJPY
- USDRUB
- All
- M5
- M15
- M30
- H1
- D1
- All
- Buy
- Sale
- All
- 1
- 2
- 3
- 4
- 5
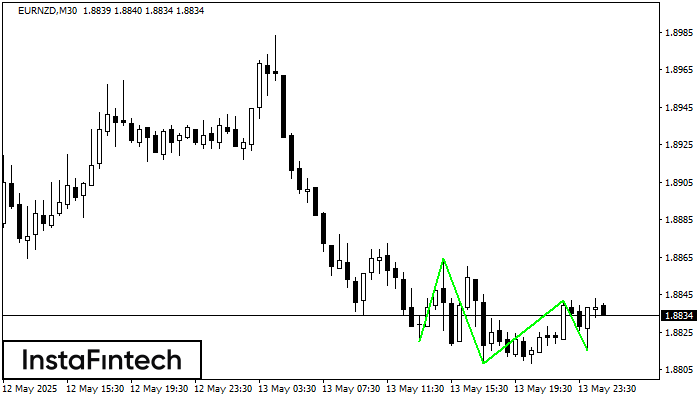
O padrão Fundo triplo foi formado em EURNZD M30. Possui as seguintes características: nível de resistência 1.8864/1.8842; nível de suporte 1.8820/1.8815; a largura é de 44 pontos. Se houver
Open chart in a new window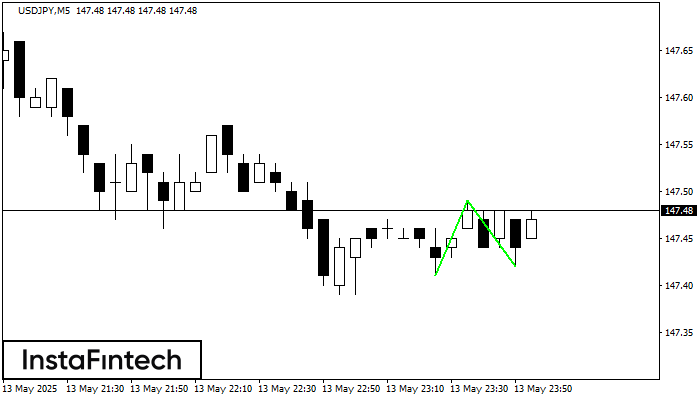
O padrão Fundo duplo foi formado em USDJPY M5. Características: o nível de suporte 147.41; o nível de resistência 147.49; a largura do padrão 8 pontos. Se o nível
Os intervalos M5 e M15 podem ter mais pontos de entrada falsos.
Open chart in a new window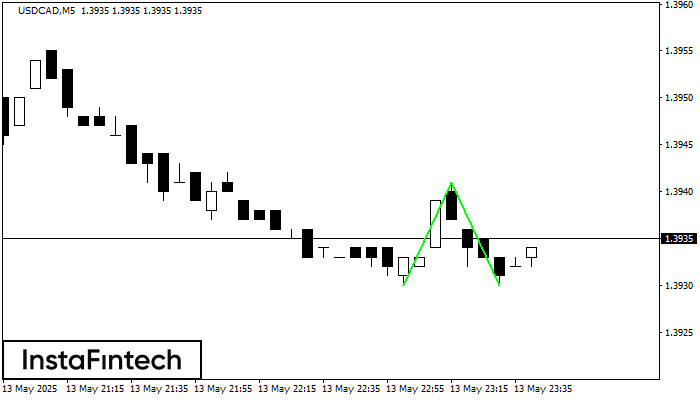
O padrão Fundo duplo foi formado em USDCAD M5; o limite superior é 1.3941; o limite inferior é 1.3930. A largura do padrão é de 11 pontos. No caso
Os intervalos M5 e M15 podem ter mais pontos de entrada falsos.
Open chart in a new window


