

signal strength 1 of 5
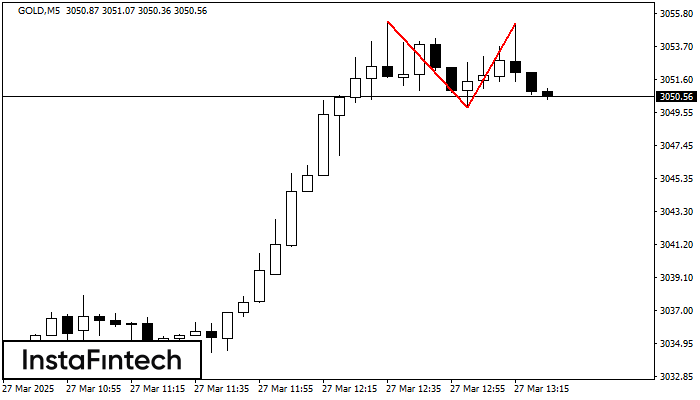
The Double Top pattern has been formed on GOLD M5. It signals that the trend has been changed from upwards to downwards. Probably, if the base of the pattern 3049.86 is broken, the downward movement will continue.
The M5 and M15 time frames may have more false entry points.
Veja também
- All
- Double Top
- Flag
- Head and Shoulders
- Pennant
- Rectangle
- Triangle
- Triple top
- All
- #AAPL
- #AMZN
- #Bitcoin
- #EBAY
- #FB
- #GOOG
- #INTC
- #KO
- #MA
- #MCD
- #MSFT
- #NTDOY
- #PEP
- #TSLA
- #TWTR
- AUDCAD
- AUDCHF
- AUDJPY
- AUDUSD
- EURCAD
- EURCHF
- EURGBP
- EURJPY
- EURNZD
- EURRUB
- EURUSD
- GBPAUD
- GBPCHF
- GBPJPY
- GBPUSD
- GOLD
- NZDCAD
- NZDCHF
- NZDJPY
- NZDUSD
- SILVER
- USDCAD
- USDCHF
- USDJPY
- USDRUB
- All
- M5
- M15
- M30
- H1
- D1
- All
- Buy
- Sale
- All
- 1
- 2
- 3
- 4
- 5
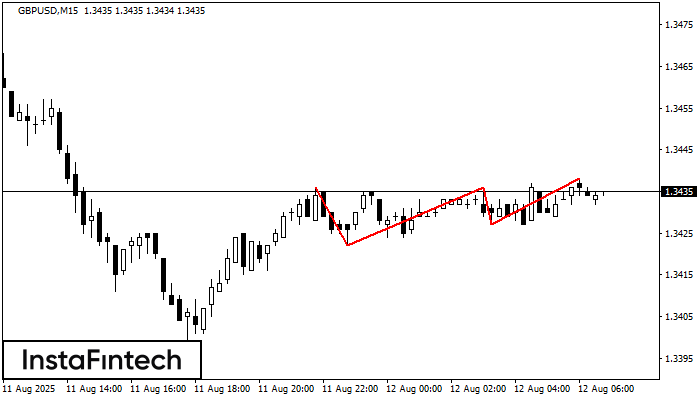
O padrão Topo triplo se formou no gráfico de GBPUSD M15. Características do padrão: os limites têm um ângulo ascendente; a linha inferior do padrão tem as coordenadas 1.3422/1.3427
Os intervalos M5 e M15 podem ter mais pontos de entrada falsos.
Open chart in a new window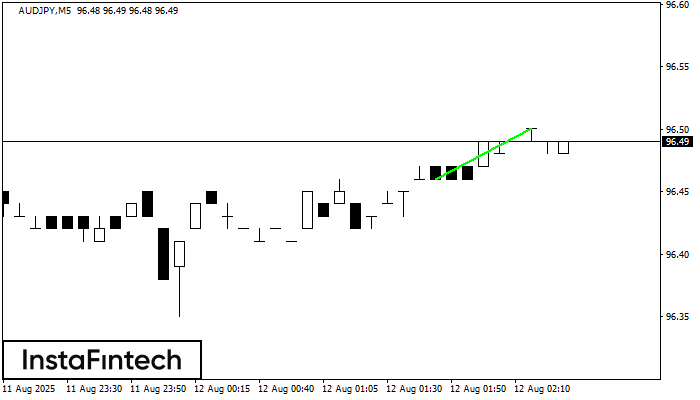
O padrão Bandeira de Alta que sinaliza a continuação de uma tendência foi formado no gráfico AUDJPY M5. Previsão: se o preço ultrapassar o padrão de alta em 96.50
Os intervalos M5 e M15 podem ter mais pontos de entrada falsos.
Open chart in a new window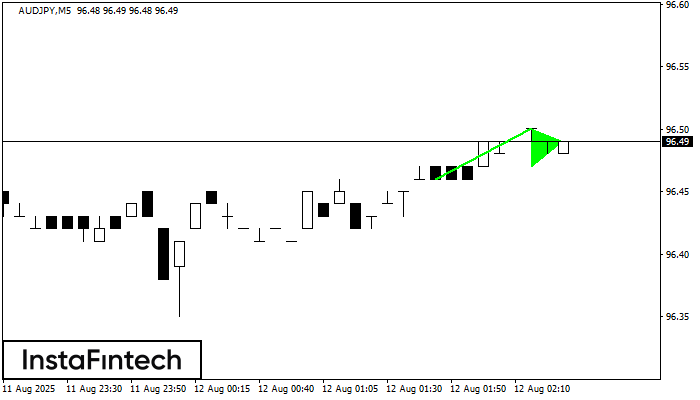
O sinal de Pennant de alta – Instrumento de negociação AUDJPY M5, padrão de continuação. Previsão: é possível definir uma posição de compra acima da altura do padrão de 96.50
Os intervalos M5 e M15 podem ter mais pontos de entrada falsos.
Open chart in a new window


