


signal strength 1 of 5

According to the chart of M5, GBPAUD formed the Head and Shoulders pattern. The Head’s top is set at 2.0644 while the median line of the Neck is found at 2.0617/2.0613. The formation of the Head and Shoulders pattern evidently signals a reversal of the upward trend. In other words, in case the scenario comes true, the price of GBPAUD will go towards 2.0598.
The M5 and M15 time frames may have more false entry points.
- All
- Double Top
- Flag
- Head and Shoulders
- Pennant
- Rectangle
- Triangle
- Triple top
- All
- #AAPL
- #AMZN
- #Bitcoin
- #EBAY
- #FB
- #GOOG
- #INTC
- #KO
- #MA
- #MCD
- #MSFT
- #NTDOY
- #PEP
- #TSLA
- #TWTR
- AUDCAD
- AUDCHF
- AUDJPY
- AUDUSD
- EURCAD
- EURCHF
- EURGBP
- EURJPY
- EURNZD
- EURRUB
- EURUSD
- GBPAUD
- GBPCHF
- GBPJPY
- GBPUSD
- GOLD
- NZDCAD
- NZDCHF
- NZDJPY
- NZDUSD
- SILVER
- USDCAD
- USDCHF
- USDJPY
- USDRUB
- All
- M5
- M15
- M30
- H1
- D1
- All
- Buy
- Sale
- All
- 1
- 2
- 3
- 4
- 5
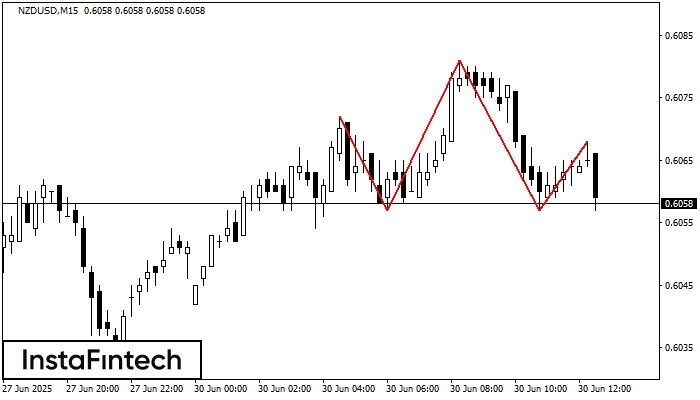
Os NZDUSD M15 formaram o padrão Cabeça & Ombros com as seguintes características: O topo da cabeça está em 0.6081, a linha do pescoço e o ângulo para cima estão
Os intervalos M5 e M15 podem ter mais pontos de entrada falsos.
Open chart in a new window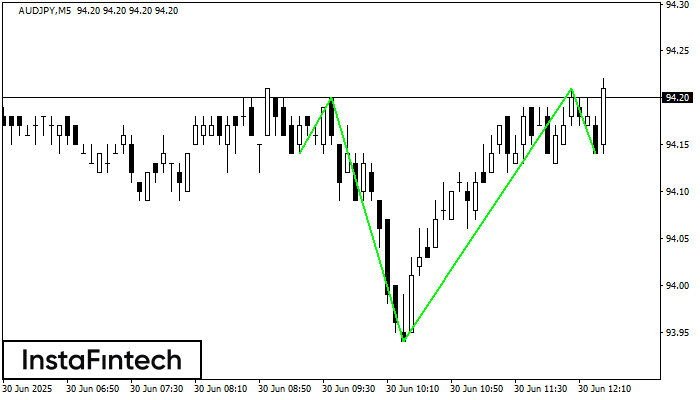
De acordo com M5, AUDJPY está moldando o padrão técnico – os Cabeça & Ombro Invertidos. Caso a linha de pescoço 94.20/94.21 seja quebrada, o instrumento provavelmente se moverá para
Os intervalos M5 e M15 podem ter mais pontos de entrada falsos.
Open chart in a new window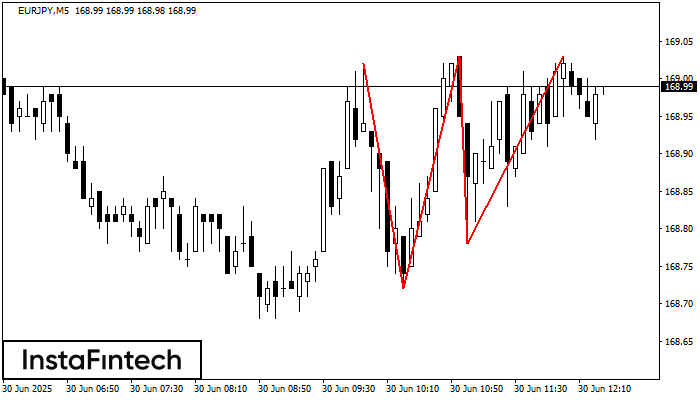
O padrão Topo triplo se formou no gráfico de EURJPY M5. Características do padrão: os limites têm um ângulo ascendente; a linha inferior do padrão tem as coordenadas 168.72/168.78
Os intervalos M5 e M15 podem ter mais pontos de entrada falsos.
Open chart in a new window


