

signal strength 2 of 5
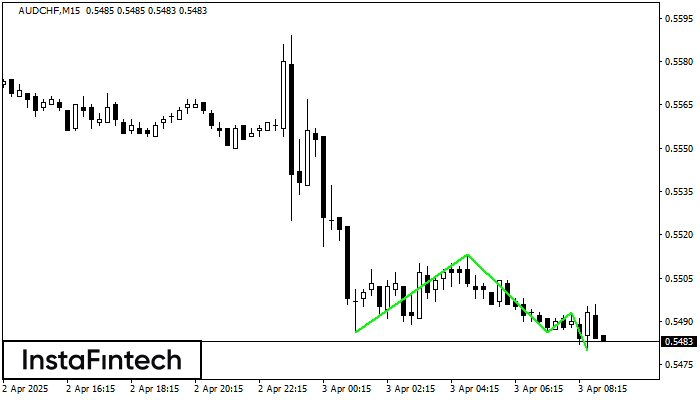
The Triple Bottom pattern has been formed on AUDCHF M15. It has the following characteristics: resistance level 0.5513/0.5493; support level 0.5486/0.5480; the width is 27 points. In the event of a breakdown of the resistance level of 0.5513, the price is likely to continue an upward movement at least to 0.5508.
The M5 and M15 time frames may have more false entry points.
- All
- Double Top
- Flag
- Head and Shoulders
- Pennant
- Rectangle
- Triangle
- Triple top
- All
- #AAPL
- #AMZN
- #Bitcoin
- #EBAY
- #FB
- #GOOG
- #INTC
- #KO
- #MA
- #MCD
- #MSFT
- #NTDOY
- #PEP
- #TSLA
- #TWTR
- AUDCAD
- AUDCHF
- AUDJPY
- AUDUSD
- EURCAD
- EURCHF
- EURGBP
- EURJPY
- EURNZD
- EURRUB
- EURUSD
- GBPAUD
- GBPCHF
- GBPJPY
- GBPUSD
- GOLD
- NZDCAD
- NZDCHF
- NZDJPY
- NZDUSD
- SILVER
- USDCAD
- USDCHF
- USDJPY
- USDRUB
- All
- M5
- M15
- M30
- H1
- D1
- All
- Buy
- Sale
- All
- 1
- 2
- 3
- 4
- 5

O padrão Fundo duplo foi formado em AUDCHF M30. Esta formação sinaliza uma reversão da tendência de baixo para cima. O sinal é que uma negociação de compra deve
Open chart in a new window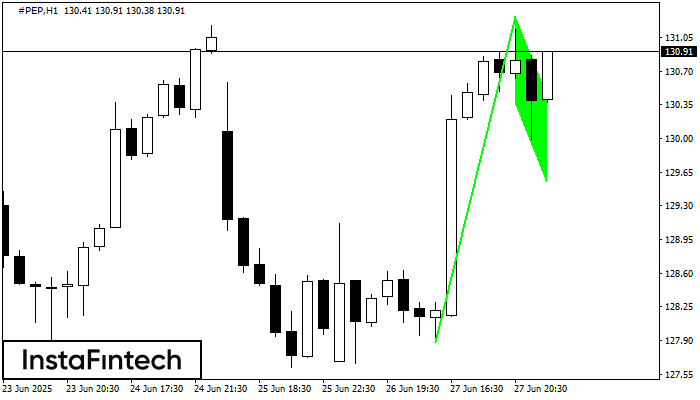
O padrão Bandeira de Alta foi formado no gráfico #PEP H1, o que sinaliza que a tendência ascendente continuará. Sinais: uma quebra do pico em 131.27 pode empurrar o preço
Open chart in a new window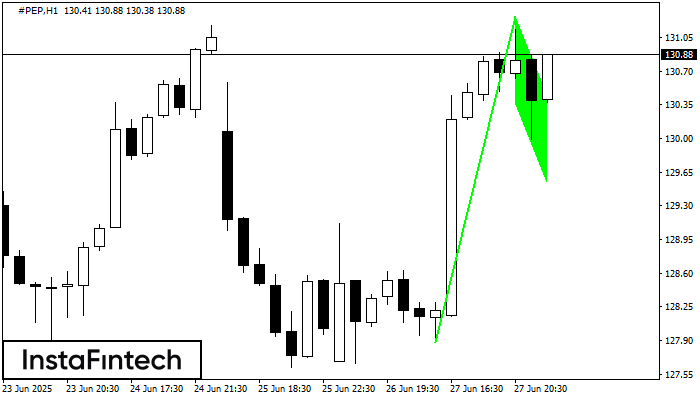
O padrão Bandeira de Alta foi formado no gráfico #PEP H1, o que sinaliza que a tendência ascendente continuará. Sinais: uma quebra do pico em 131.27 pode empurrar o preço
Open chart in a new window


