


signal strength 1 of 5

According to the chart of M5, NZDCAD formed the Inverse Head and Shoulder pattern. The Head’s top is set at 0.7904 while the median line of the Neck is found at 0.7863/0.7887. The formation of the Inverse Head and Shoulder pattern evidently signals a reversal of the downward trend. In other words, in case the scenario comes true, the price of NZDCAD will go towards 0.7919
The M5 and M15 time frames may have more false entry points.
- All
- Double Top
- Flag
- Head and Shoulders
- Pennant
- Rectangle
- Triangle
- Triple top
- All
- #AAPL
- #AMZN
- #Bitcoin
- #EBAY
- #FB
- #GOOG
- #INTC
- #KO
- #MA
- #MCD
- #MSFT
- #NTDOY
- #PEP
- #TSLA
- #TWTR
- AUDCAD
- AUDCHF
- AUDJPY
- AUDUSD
- EURCAD
- EURCHF
- EURGBP
- EURJPY
- EURNZD
- EURRUB
- EURUSD
- GBPAUD
- GBPCHF
- GBPJPY
- GBPUSD
- GOLD
- NZDCAD
- NZDCHF
- NZDJPY
- NZDUSD
- SILVER
- USDCAD
- USDCHF
- USDJPY
- USDRUB
- All
- M5
- M15
- M30
- H1
- D1
- All
- Buy
- Sale
- All
- 1
- 2
- 3
- 4
- 5
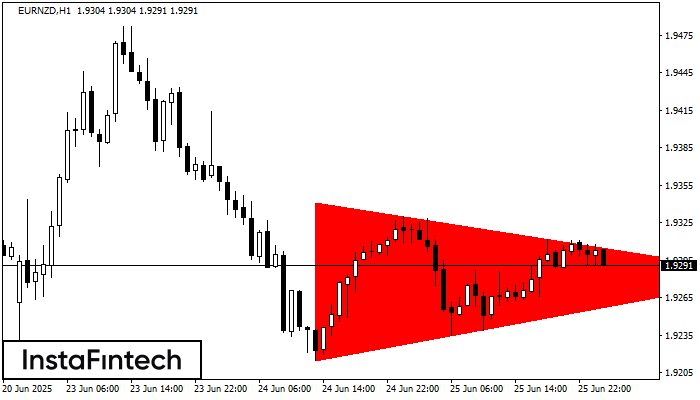
De acordo com o gráfico de H1, EURNZD fomrou o padrão de Triângulo Simétrico de Baixa. Este padrão sinaliza uma nova tendência de baixa se o limite inferior 1.9215
Open chart in a new window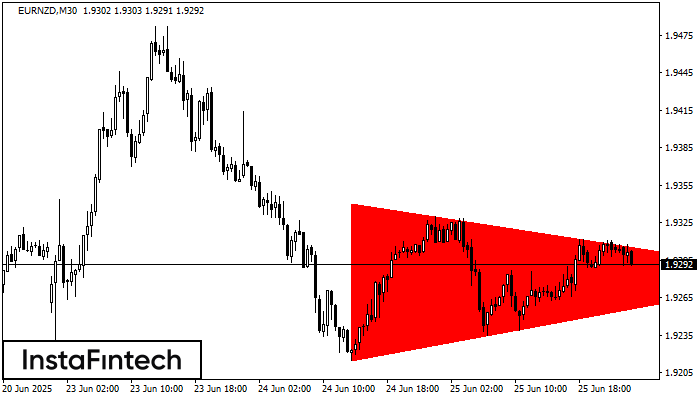
De acordo com o gráfico de M30, EURNZD formou o padrão de Triângulo Simétrico de Baixa. Recomendações de negociação: Uma quebra do limite inferior de 1.9215 pode encorajar a continuação
Open chart in a new window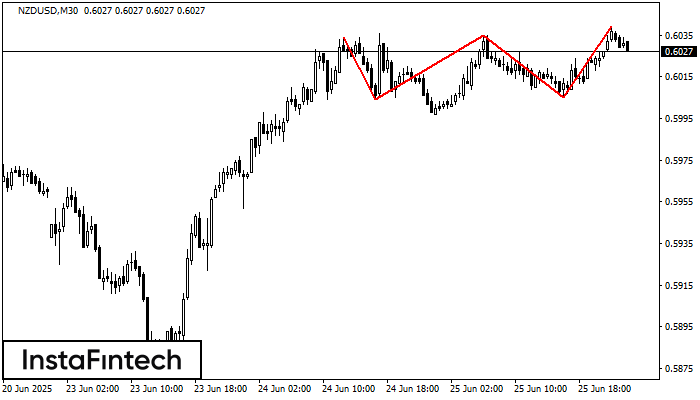
O padrão Topo triplo foi formado no gráfico do instrumento de negociação NZDUSD M30. É um padrão de reversão com as seguintes características: nível de resistência -5, nível de suporte
Open chart in a new window


