

signal strength 3 of 5

According to the chart of M30, EURCHF formed the Inverse Head and Shoulder pattern. The Head’s top is set at 0.9269 while the median line of the Neck is found at 0.9229/0.9253. The formation of the Inverse Head and Shoulder pattern evidently signals a reversal of the downward trend. In other words, in case the scenario comes true, the price of EURCHF will go towards 0.9299
Veja também
- All
- Double Top
- Flag
- Head and Shoulders
- Pennant
- Rectangle
- Triangle
- Triple top
- All
- #AAPL
- #AMZN
- #Bitcoin
- #EBAY
- #FB
- #GOOG
- #INTC
- #KO
- #MA
- #MCD
- #MSFT
- #NTDOY
- #PEP
- #TSLA
- #TWTR
- AUDCAD
- AUDCHF
- AUDJPY
- AUDUSD
- EURCAD
- EURCHF
- EURGBP
- EURJPY
- EURNZD
- EURRUB
- EURUSD
- GBPAUD
- GBPCHF
- GBPJPY
- GBPUSD
- GOLD
- NZDCAD
- NZDCHF
- NZDJPY
- NZDUSD
- SILVER
- USDCAD
- USDCHF
- USDJPY
- USDRUB
- All
- M5
- M15
- M30
- H1
- D1
- All
- Buy
- Sale
- All
- 1
- 2
- 3
- 4
- 5
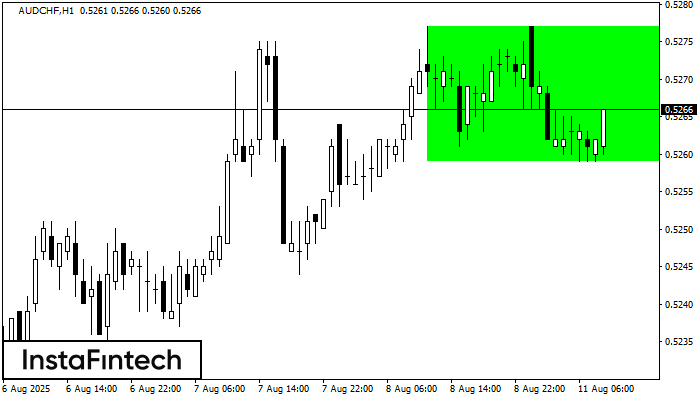
Conforme o gráfico de H1, AUDCHF formou o Retângulo de alta. Este tipo de padrão indica uma continuação da tendência. Ele consiste em dois níveis: resistência 0.5277 e suporte 0.5259
Open chart in a new window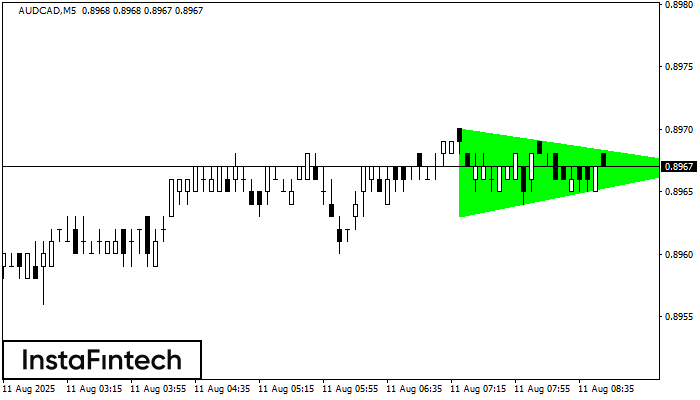
De acordo com o gráfico de M5, AUDCAD formou o padrão de Triângulo Simétrico de Alta, sinalizando que a tendência continuará. Descrição: O limite superior do padrão toca as coordenadas
Os intervalos M5 e M15 podem ter mais pontos de entrada falsos.
Open chart in a new window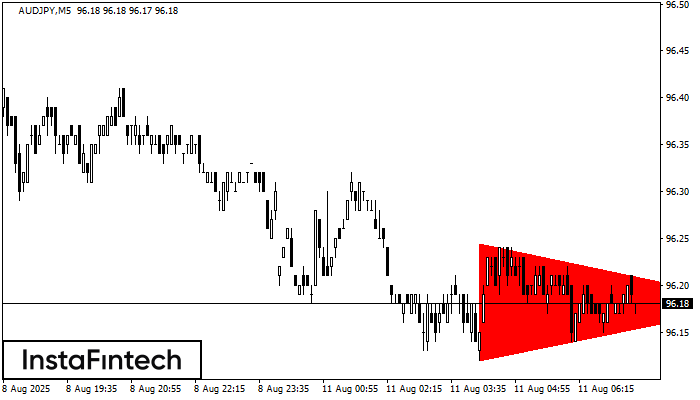
De acordo com o gráfico de M5, AUDJPY formou o padrão Triângulo Simétrico de Baixa. Descrição: o limite inferior é 96.12/96.18 e o limite superior é 96.24/96.18. A largura
Os intervalos M5 e M15 podem ter mais pontos de entrada falsos.
Open chart in a new window


