


signal strength 1 of 5

According to the chart of M5, GBPCHF formed the Head and Shoulders pattern. The Head’s top is set at 1.1418 while the median line of the Neck is found at 1.1408/1.1408. The formation of the Head and Shoulders pattern evidently signals a reversal of the upward trend. In other words, in case the scenario comes true, the price of GBPCHF will go towards 1.1393.
The M5 and M15 time frames may have more false entry points.
- All
- Double Top
- Flag
- Head and Shoulders
- Pennant
- Rectangle
- Triangle
- Triple top
- All
- #AAPL
- #AMZN
- #Bitcoin
- #EBAY
- #FB
- #GOOG
- #INTC
- #KO
- #MA
- #MCD
- #MSFT
- #NTDOY
- #PEP
- #TSLA
- #TWTR
- AUDCAD
- AUDCHF
- AUDJPY
- AUDUSD
- EURCAD
- EURCHF
- EURGBP
- EURJPY
- EURNZD
- EURRUB
- EURUSD
- GBPAUD
- GBPCHF
- GBPJPY
- GBPUSD
- GOLD
- NZDCAD
- NZDCHF
- NZDJPY
- NZDUSD
- SILVER
- USDCAD
- USDCHF
- USDJPY
- USDRUB
- All
- M5
- M15
- M30
- H1
- D1
- All
- Buy
- Sale
- All
- 1
- 2
- 3
- 4
- 5
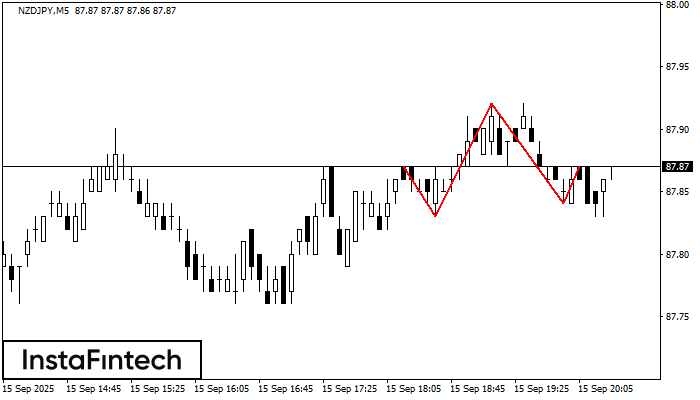
The technical pattern called Head and Shoulders has appeared on the chart of NZDJPY M5. There are weighty reasons to suggest that the price will surpass the Neckline 87.83/87.84 after
The M5 and M15 time frames may have more false entry points.
Open chart in a new window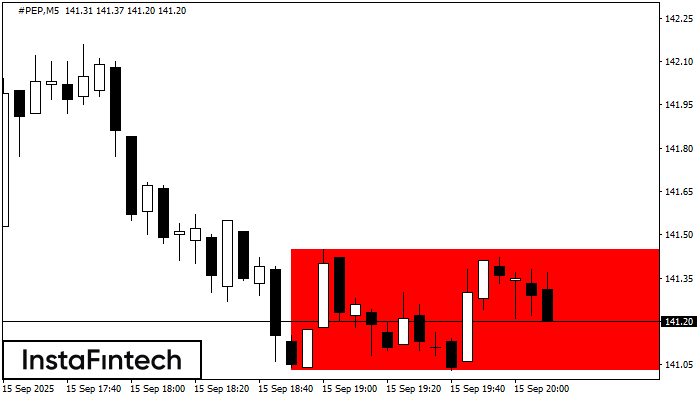
According to the chart of M5, #PEP formed the Bearish Rectangle which is a pattern of a trend continuation. The pattern is contained within the following borders: lower border 141.03
The M5 and M15 time frames may have more false entry points.
Open chart in a new window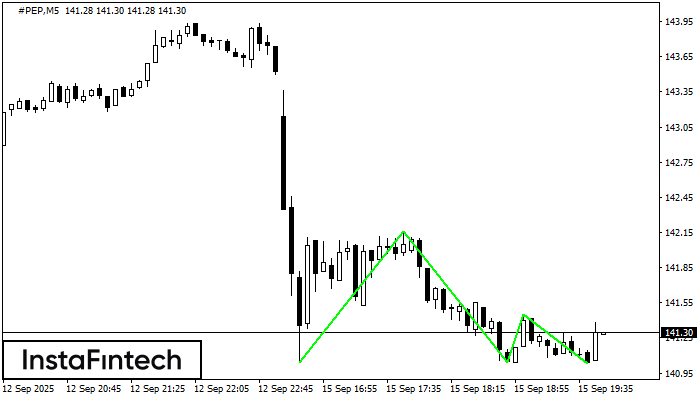
The Triple Bottom pattern has been formed on #PEP M5. It has the following characteristics: resistance level 142.16/141.45; support level 141.04/141.03; the width is 112 points. In the event
The M5 and M15 time frames may have more false entry points.
Open chart in a new window


