


signal strength 3 of 5

The Bearish pennant pattern has formed on the NZDUSD M30 chart. It signals potential continuation of the existing trend. Specifications: the pattern’s bottom has the coordinate of 0.5563; the projection of the flagpole height is equal to 29 pips. In case the price breaks out the pattern’s bottom of 0.5563, the downtrend is expected to continue for further level 0.5533.
See Also
- All
- Double Top
- Flag
- Head and Shoulders
- Pennant
- Rectangle
- Triangle
- Triple top
- All
- #AAPL
- #AMZN
- #Bitcoin
- #EBAY
- #FB
- #GOOG
- #INTC
- #KO
- #MA
- #MCD
- #MSFT
- #NTDOY
- #PEP
- #TSLA
- #TWTR
- AUDCAD
- AUDCHF
- AUDJPY
- AUDUSD
- EURCAD
- EURCHF
- EURGBP
- EURJPY
- EURNZD
- EURRUB
- EURUSD
- GBPAUD
- GBPCHF
- GBPJPY
- GBPUSD
- GOLD
- NZDCAD
- NZDCHF
- NZDJPY
- NZDUSD
- SILVER
- USDCAD
- USDCHF
- USDJPY
- USDRUB
- All
- M5
- M15
- M30
- H1
- D1
- All
- Buy
- Sale
- All
- 1
- 2
- 3
- 4
- 5
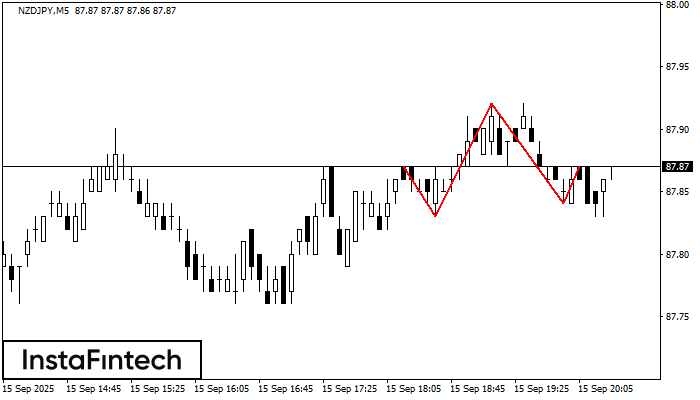
El patrón técnico llamado Cabeza y Hombros ha aparecido en el gráfico de NZDJPY M5. Existen razones poderosas para sugerir que el precio superará la línea de cuello 87.83/87.84 después
Los marcos de tiempo M5 y M15 pueden tener más puntos de entrada falsos.
Open chart in a new window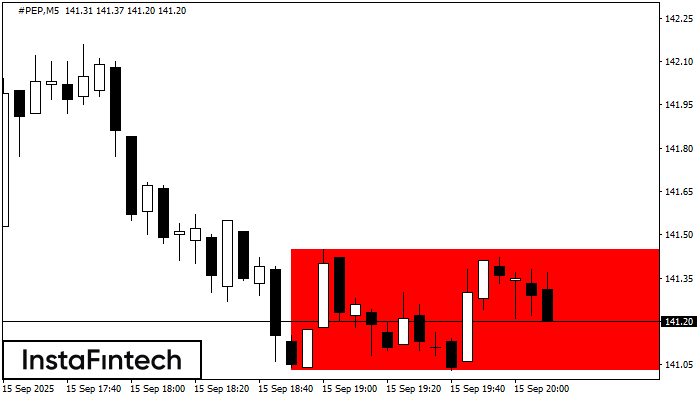
Según el gráfico de M5, #PEP formó el Rectángulo Bajista que es un patrón de la continuación de una tendencia. El patrón está contenido dentro de los siguientes límites: límite
Los marcos de tiempo M5 y M15 pueden tener más puntos de entrada falsos.
Open chart in a new window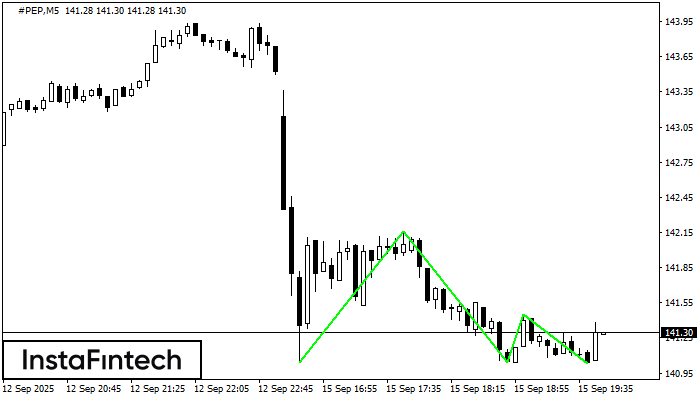
El patrón Triple Piso ha sido formado en #PEP M5. Este tiene las siguientes características: nivel de resistencia 142.16/141.45; nivel de soporte 141.04/141.03; el ancho es 112 puntos. En caso
Los marcos de tiempo M5 y M15 pueden tener más puntos de entrada falsos.
Open chart in a new window


