сила сигнала 3 из 5
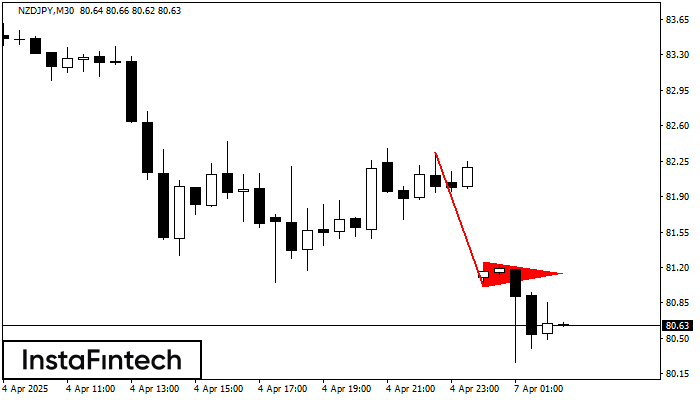
По торговому инструменту NZDJPY на M30 сформировалась графическая фигура «Медвежий вымпел». Фигура данного типа характеризует небольшое замедление, после которого движение продолжится в исходном тренде. В случае если котировке удастся зафиксироваться ниже минимума образованной фигуры 81.01, трейдеру представится возможность удачно войти в позицию на продажу.
Смотрите также
- Все
- Вымпел
- Голова и плечи
- Двойная вершина
- Прямоугольник
- Треугольник
- Тройная вершина
- Флаг
- Все
- #AAPL
- #AMZN
- #Bitcoin
- #EBAY
- #FB
- #GOOG
- #INTC
- #KO
- #MA
- #MCD
- #MSFT
- #NTDOY
- #PEP
- #TSLA
- #TWTR
- AUDCAD
- AUDCHF
- AUDJPY
- AUDUSD
- EURCAD
- EURCHF
- EURGBP
- EURJPY
- EURNZD
- EURRUB
- EURUSD
- GBPAUD
- GBPCHF
- GBPJPY
- GBPUSD
- GOLD
- NZDCAD
- NZDCHF
- NZDJPY
- NZDUSD
- SILVER
- USDCAD
- USDCHF
- USDJPY
- USDRUB
- Все
- M5
- M15
- M30
- H1
- D1
- Все
- Покупка
- Продажа
- Все
- 1
- 2
- 3
- 4
- 5

According to the chart of M15, #TSLA formed the Bullish Symmetrical Triangle pattern. The lower border of the pattern touches the coordinates 332.24/342.17 whereas the upper border goes across 349.71/342.17
The M5 and M15 time frames may have more false entry points.
Open chart in a new window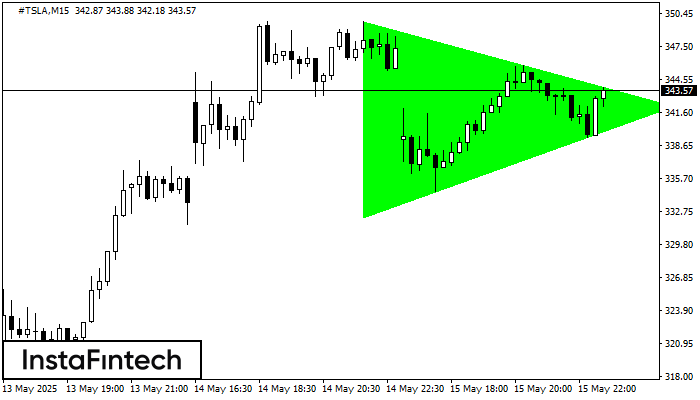
According to the chart of M15, #TSLA formed the Bullish Symmetrical Triangle pattern. The lower border of the pattern touches the coordinates 332.24/342.17 whereas the upper border goes across 349.71/342.17
The M5 and M15 time frames may have more false entry points.
Open chart in a new window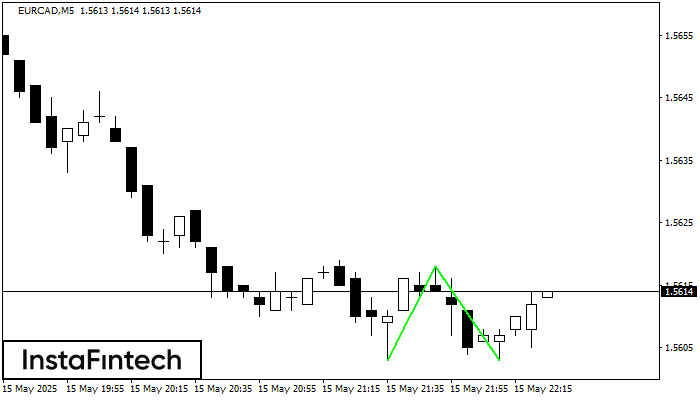
The Double Bottom pattern has been formed on EURCAD M5; the upper boundary is 1.5618; the lower boundary is 1.5603. The width of the pattern is 15 points. In case
The M5 and M15 time frames may have more false entry points.
Open chart in a new window