

signal strength 3 of 5
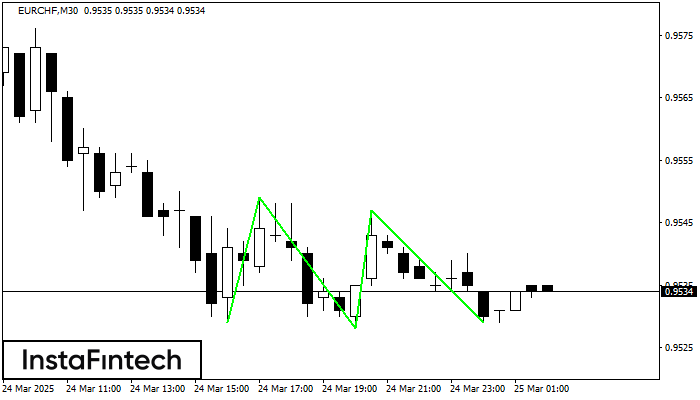
The Triple Bottom pattern has formed on the chart of the EURCHF M30 trading instrument. The pattern signals a change in the trend from downwards to upwards in the case of breakdown of 0.9549/0.9547.
See Also
- All
- Double Top
- Flag
- Head and Shoulders
- Pennant
- Rectangle
- Triangle
- Triple top
- All
- #AAPL
- #AMZN
- #Bitcoin
- #EBAY
- #FB
- #GOOG
- #INTC
- #KO
- #MA
- #MCD
- #MSFT
- #NTDOY
- #PEP
- #TSLA
- #TWTR
- AUDCAD
- AUDCHF
- AUDJPY
- AUDUSD
- EURCAD
- EURCHF
- EURGBP
- EURJPY
- EURNZD
- EURRUB
- EURUSD
- GBPAUD
- GBPCHF
- GBPJPY
- GBPUSD
- GOLD
- NZDCAD
- NZDCHF
- NZDJPY
- NZDUSD
- SILVER
- USDCAD
- USDCHF
- USDJPY
- USDRUB
- All
- M5
- M15
- M30
- H1
- D1
- All
- Buy
- Sale
- All
- 1
- 2
- 3
- 4
- 5
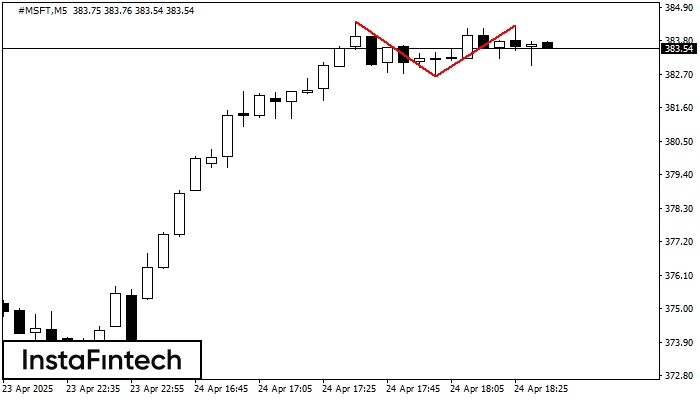
The Double Top pattern has been formed on #MSFT M5. It signals that the trend has been changed from upwards to downwards. Probably, if the base of the pattern 382.62
The M5 and M15 time frames may have more false entry points.
Open chart in a new window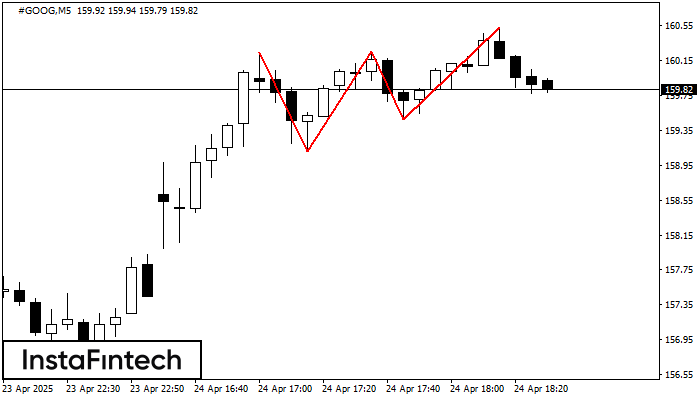
On the chart of the #GOOG M5 trading instrument, the Triple Top pattern that signals a trend change has formed. It is possible that after formation of the third peak
The M5 and M15 time frames may have more false entry points.
Open chart in a new window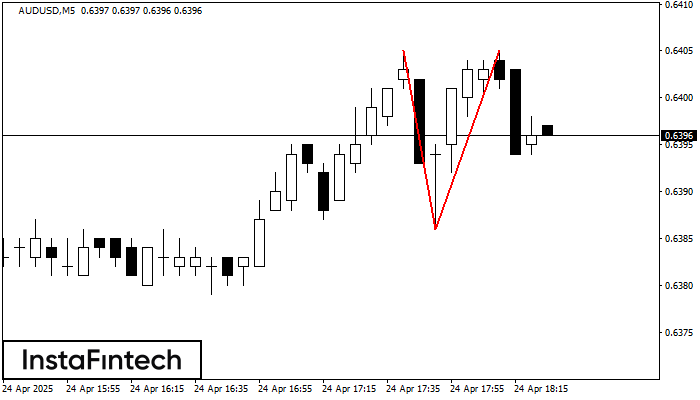
On the chart of AUDUSD M5 the Double Top reversal pattern has been formed. Characteristics: the upper boundary 0.6405; the lower boundary 0.6386; the width of the pattern 19 points
The M5 and M15 time frames may have more false entry points.
Open chart in a new window


