


signal strength 1 of 5
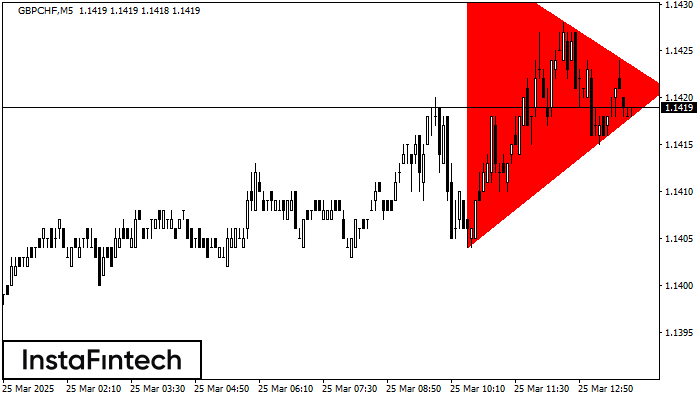
According to the chart of M5, GBPCHF formed the Bearish Symmetrical Triangle pattern. This pattern signals a further downward trend in case the lower border 1.1404 is breached. Here, a hypothetical profit will equal the width of the available pattern that is -31 pips.
The M5 and M15 time frames may have more false entry points.
See Also
- All
- Double Top
- Flag
- Head and Shoulders
- Pennant
- Rectangle
- Triangle
- Triple top
- All
- #AAPL
- #AMZN
- #Bitcoin
- #EBAY
- #FB
- #GOOG
- #INTC
- #KO
- #MA
- #MCD
- #MSFT
- #NTDOY
- #PEP
- #TSLA
- #TWTR
- AUDCAD
- AUDCHF
- AUDJPY
- AUDUSD
- EURCAD
- EURCHF
- EURGBP
- EURJPY
- EURNZD
- EURRUB
- EURUSD
- GBPAUD
- GBPCHF
- GBPJPY
- GBPUSD
- GOLD
- NZDCAD
- NZDCHF
- NZDJPY
- NZDUSD
- SILVER
- USDCAD
- USDCHF
- USDJPY
- USDRUB
- All
- M5
- M15
- M30
- H1
- D1
- All
- Buy
- Sale
- All
- 1
- 2
- 3
- 4
- 5
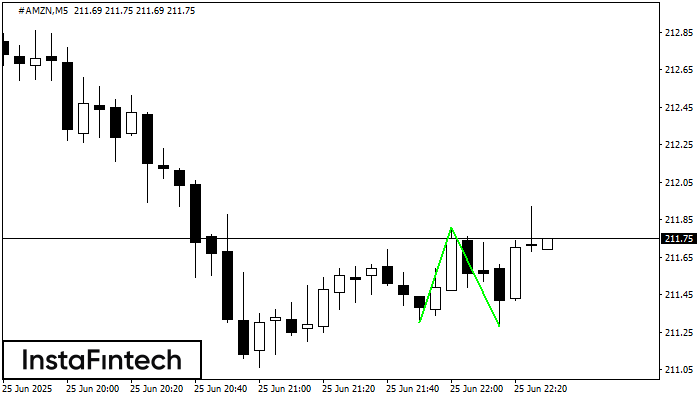
The Double Bottom pattern has been formed on #AMZN M5. This formation signals a reversal of the trend from downwards to upwards. The signal is that a buy trade should
The M5 and M15 time frames may have more false entry points.
Open chart in a new window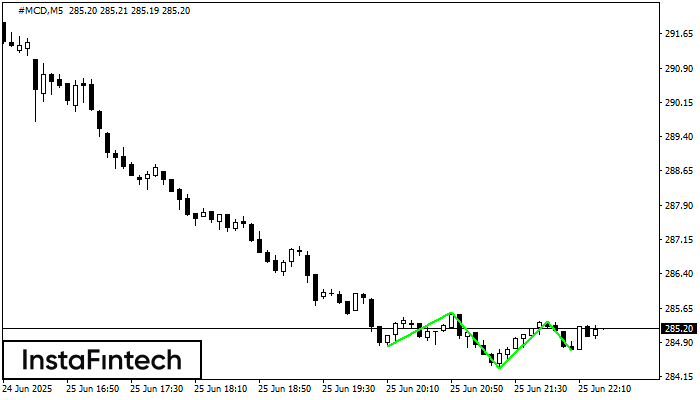
According to M5, #MCD is shaping the technical pattern – the Inverse Head and Shoulder. In case the Neckline 285.56/285.36 is broken out, the instrument is likely to move toward
The M5 and M15 time frames may have more false entry points.
Open chart in a new window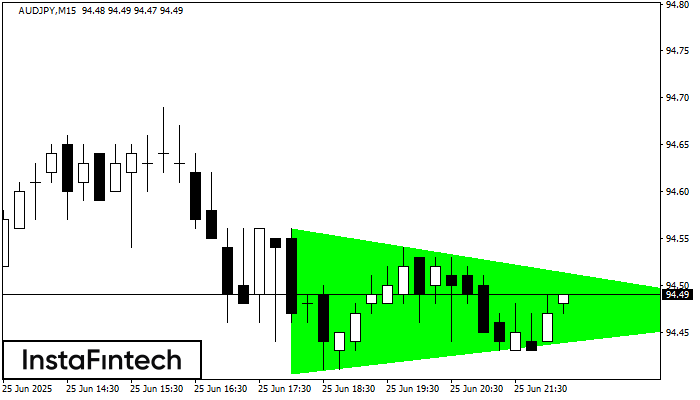
According to the chart of M15, AUDJPY formed the Bullish Symmetrical Triangle pattern, which signals the trend will continue. Description. The upper border of the pattern touches the coordinates 94.56/94.47
The M5 and M15 time frames may have more false entry points.
Open chart in a new window


