

signal strength 1 of 5
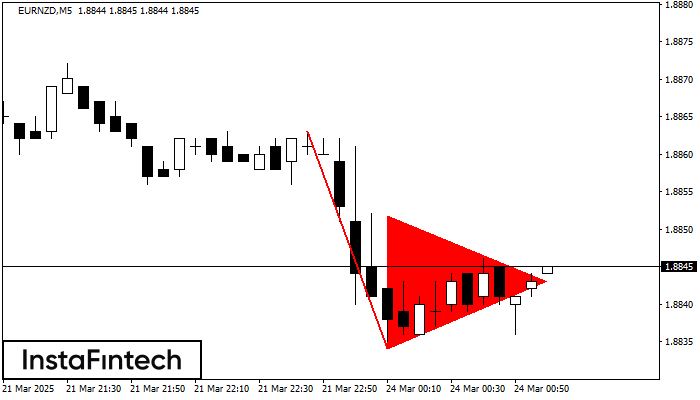
The Bearish pennant pattern has formed on the EURNZD M5 chart. It signals potential continuation of the existing trend. Specifications: the pattern’s bottom has the coordinate of 1.8834; the projection of the flagpole height is equal to 29 pips. In case the price breaks out the pattern’s bottom of 1.8834, the downtrend is expected to continue for further level 1.8819.
The M5 and M15 time frames may have more false entry points.
- All
- Double Top
- Flag
- Head and Shoulders
- Pennant
- Rectangle
- Triangle
- Triple top
- All
- #AAPL
- #AMZN
- #Bitcoin
- #EBAY
- #FB
- #GOOG
- #INTC
- #KO
- #MA
- #MCD
- #MSFT
- #NTDOY
- #PEP
- #TSLA
- #TWTR
- AUDCAD
- AUDCHF
- AUDJPY
- AUDUSD
- EURCAD
- EURCHF
- EURGBP
- EURJPY
- EURNZD
- EURRUB
- EURUSD
- GBPAUD
- GBPCHF
- GBPJPY
- GBPUSD
- GOLD
- NZDCAD
- NZDCHF
- NZDJPY
- NZDUSD
- SILVER
- USDCAD
- USDCHF
- USDJPY
- USDRUB
- All
- M5
- M15
- M30
- H1
- D1
- All
- Buy
- Sale
- All
- 1
- 2
- 3
- 4
- 5

El patrón Triple Piso ha sido formado en #Bitcoin M30. Este tiene las siguientes características: nivel de resistencia 103658.13/103057.03; nivel de soporte 102549.85/102590.27; el ancho es 110828 puntos. En caso
Open chart in a new window
Según el gráfico de M5, #Bitcoin produjo el patrón llamado el Cabeza y Hombros Inverso. La Cabeza está establecida en 102549.85 mientras la línea media del Cuello se encuentra
Los marcos de tiempo M5 y M15 pueden tener más puntos de entrada falsos.
Open chart in a new window
El patrón Doble Piso ha sido formado en #Bitcoin M5; el límite superior es 103642.04; el límite inferior es 103357.83. El ancho del patrón es 27887 puntos. En caso
Los marcos de tiempo M5 y M15 pueden tener más puntos de entrada falsos.
Open chart in a new window


