


signal strength 3 of 5

The Triple Top pattern has formed on the chart of the EURCAD M30. Features of the pattern: borders have an ascending angle; the lower line of the pattern has the coordinates 1.5476/1.5505 with the upper limit 1.5517/1.5519; the projection of the width is 41 points. The formation of the Triple Top figure most likely indicates a change in the trend from upward to downward. This means that in the event of a breakdown of the support level of 1.5476, the price is most likely to continue the downward movement.
Vea asimismo
- All
- Double Top
- Flag
- Head and Shoulders
- Pennant
- Rectangle
- Triangle
- Triple top
- All
- #AAPL
- #AMZN
- #Bitcoin
- #EBAY
- #FB
- #GOOG
- #INTC
- #KO
- #MA
- #MCD
- #MSFT
- #NTDOY
- #PEP
- #TSLA
- #TWTR
- AUDCAD
- AUDCHF
- AUDJPY
- AUDUSD
- EURCAD
- EURCHF
- EURGBP
- EURJPY
- EURNZD
- EURRUB
- EURUSD
- GBPAUD
- GBPCHF
- GBPJPY
- GBPUSD
- GOLD
- NZDCAD
- NZDCHF
- NZDJPY
- NZDUSD
- SILVER
- USDCAD
- USDCHF
- USDJPY
- USDRUB
- All
- M5
- M15
- M30
- H1
- D1
- All
- Buy
- Sale
- All
- 1
- 2
- 3
- 4
- 5
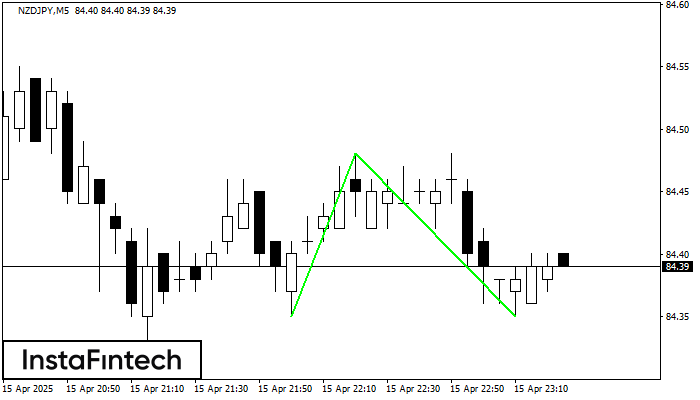
El patrón Doble Piso ha sido formado en NZDJPY M5. Características: el nivel de soporte 84.35; el nivel de resistencia 84.48; el ancho del patrón 13 puntos. Si el nivel
Los marcos de tiempo M5 y M15 pueden tener más puntos de entrada falsos.
Open chart in a new window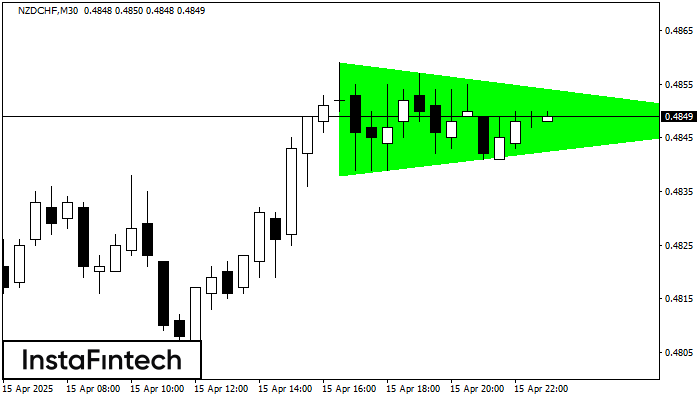
Según el gráfico de M30, el NZDCHF formó el patrón Triángulo Simétrico Alcista. El límite inferior del patrón toca las coordenadas 0.4838/0.4848 donde el límite superior cruza 0.4859/0.4848
Open chart in a new window
Según el gráfico de M30, NZDCHF formó el Rectángulo Alcista. Este tipo de patrón indica la continuación de una tendencia. Esto consiste de dos niveles: resistencia 0.4859 y soporte 0.4839
Open chart in a new window


