empty
20.03.2023 02:04 PM
Technical analysis of GBP/USD for March 20, 2023

This image is no longer relevant

Overview :

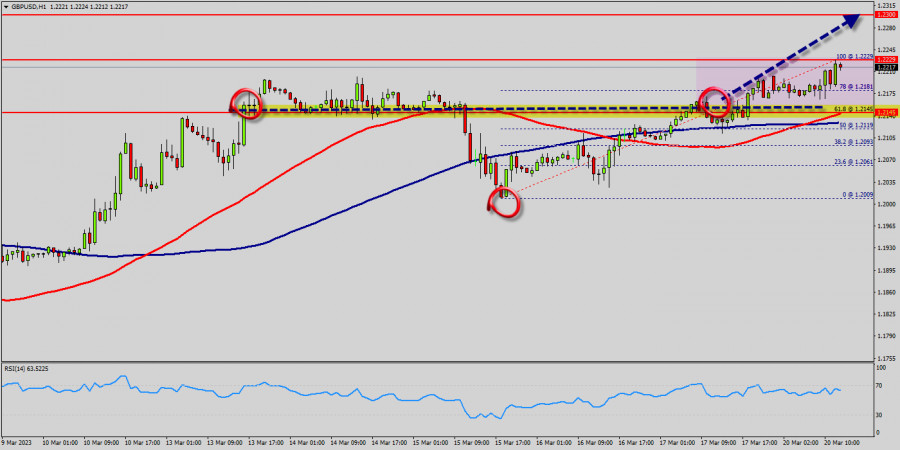
The GBP/USD pair traded higher and closed the day in the positive territory near the price of 1.2208. Right now, it was trading in a narrow range of 1.2150 staying close to a 2-days high. On the hourly chart, the GBP/USD pair is still trading above the MA (100) H1 moving average line (1.2068 - weekly pivot point). The situation is similar on the 4-hour chart. Based on the foregoing, it is probably worth sticking to the north direction in trading, and as long as the GBP/USD pair remains above MA 100 H1, it may be necessary to look for entry points to buy for the formation of a correction.

All elements being clearly bullish, it would be possible for traders to trade only long positions on the GBP/USD pair as long as the price remains well above the golden ratio of 1.2068. The buyers' bullish objective is set at 1.2209.

The price is likely to form a double top in the same time frame. Accordingly, the GBP/USD pair is showing signs of strength following a breakout of the highest level of 1.2209. So, buy above the level of 1.2068 with the first target at 1.2209 in order to test the daily resistance 1. The level of 1.2209 is a good place to take profits.

Moreover, the RSI is still signaling that the trend is upward as it remains strong above the moving average (100). This suggests that the pair will probably go up in coming hours. A bullish break in this resistance would boost the bullish momentum. Other outlook for the GBP/USD pair : Pound Sterling is currently trading at 1.2150. If the trend reverses from this point, then a possible future share price target could be 1.2209.

If the price of Pound Sterling is trading above 1.2150 then possibility of upside targets getting achieved is higher around the level of 1.2150. The basic bullish trend is very strong on the GBP/USD pair, but the short term shows some signs of running out of steam. Nevertheless, a purchase could be considered as long as the price remains above 1.2150.

Crossing the first resistance at 1.2209 would be a sign of a potential new surge in the price. Buyers would then use the next resistance located at 1.2270 as an objective. Crossing it would then enable buyers to target 1.2270. Caution, a return to below 1.2270 would be a sign of a consolidation phase in the short-term basic trend. If this is the case, remember that trading against the trend may be riskier.

It would seem more appropriate to wait for a signal indicating reversal of the trend. In the very short term, the general bullish sentiment is not called into question, despite technical indicators being indecisive. All elements being clearly bullish market, it would be possible for traders to trade only long positions on the GBP/USD pair as long as the price remains well above the price of 1.2068. The GBP/USD pair will continue rising from the level of 1.2068 in the long term.

It should be noted that the support is established at the level of 1.2068 which represents the last bearish wave. The price is likely to form a double bottom in the same time frame. Accordingly, the GBP/USD pair is showing signs of strength following a breakout of the highest level of 1.2068. So, buy above the level of 1.2068 with the first target at 1.2209 in order to test the daily resistance 1. The buyers' bullish objective is set at the level of 1.2270 (last bullish wave). A bullish break in this resistance would boost the bullish momentum.

The buyers could then target the resistance located at 1.2270 . This suggests that the pair will probably go up in coming hours. If the trend is able to break the level of 1.2209 (double top), then the market will call for a strong bullish market towards the objective of 1.2270 this week. If there is any crossing, the next objective would be the resistance located at 1.2270.

The level of 1.2270 is a good place to take profits. Moreover, the RSI is still signaling that the trend is upward as it remains strong above the moving average (100). Since the trend is above the 61.8% Fibonacci level (1.2068), it means the market is still in a uptrend. From this point, the GBP/USD pair is continuing in a bullish trend from the new support of 1.2068. This is shown to us as the current price is in a bullish channel.

According to the previous events, we expect that the GBP/USD pair will move between 1.2068 and 1.2270 in coming hours. It is also should be noted, beware of bullish excesses that could lead to a possible short-term correction; but this possible correction would not be tradeable.

On the other hand, in case a reversal takes place and the GBP/USD pair breaks through the support level of 1.2068, a further decline to 1.1981 can occur. It would indicate a bearish market.

เลือกช่วงเวลา
5
นาที
15
นาที
30
นาที
1
ชั่วโมง
4
ชั่วโมง
1
วัน
1
สัปดาห์
รับผลกำไรจากการเปลี่ยนแปลงอัตราสกุลเงินดิจิทัลกับ InstaForex.
ดาวน์โหลด MetaTrader 4 และเปิดการซื้อขายครั้งแรกของคุณ.
  • Grand Choice
    Contest by
    InstaForex
    InstaForex always strives to help you
    fulfill your biggest dreams.
    เข้าร่วมการแข่งขัน


บทความแนะนำ

XAU/USD: การวิเคราะห์, การพยากรณ์, และสถานการณ์ตลาดในปัจจุบัน

ทองคำยังคงมีโทนเสียงขาลงในระหว่างวันในวันนี้ ตัวบ่งชี้ความถี่บนแผนภูมิรายวันเริ่มแสดงถึงแรงกดดันเชิงลบ บ่งบอกถึงโอกาสที่ราคาทองคำจะยังคงลดลงอีก คู่สกุลเงิน XAU/USD ยังคงไม่สามารถทะลุแนวระดับเส้นค่าเฉลี่ยเคลื่อนที่อย่างง่าย (SMA) ระยะเวลา 100 งวดในแผนภูมิ 4 ชั่วโมงนำไปสู่การลดลงของราคาถึงระดับ $3300 พัฒนาการนี้ถูกมองว่าเป็นสัญญาณใหม่ของทัศนคติขาลงในตลาดทองคำ ในกรณีนี้

Irina Yanina 12:50 2025-07-07 UTC+2

การคาดการณ์สำหรับคู่สกุลเงิน EUR/USD ในวันที่ 7 กรกฎาคม 2025

เมื่อวันศุกร์ คู่สกุลเงิน EUR/USD มีการซื้อขายที่อ่อนแอมาก เนื่องจากความสำคัญในวันประกาศอิสรภาพของสหรัฐอเมริกาซึ่งทำให้กิจกรรมการซื้อขายลดลงเป็นอย่างมาก ส่งผลให้ไม่เกิดสัญญาณการซื้อขาย การทะลุสำคัญ ๆ หรือรูปแบบกราฟอื่น ๆ ในวันนี้ การรีบาวด์จากระดับ 1.1802 (ครั้งที่สาม) อาจเป็นที่พึงพอใจของสกุลเงินสหรัฐและกระตุ้นการลดลงไปยังระดับการปรับฐาน

Samir Klishi 11:48 2025-07-07 UTC+2

GBP/USD วันที่ 7 กรกฎาคม ฝ่ายซื้อปกป้องระดับ 1.3611

บนกราฟรายชั่วโมง คู่สกุลเงิน GBP/USD มีการเคลื่อนไหวแบบไร้ทิศทางในวันศุกร์ วันนี้ การดีดกลับใหม่จากโซนแนวรับที่ 1.3611–1.3633 อาจให้ความหวังแก่ผู้เทรดในการกลับทิศทางที่เป็นบวกของเงินปอนด์อังกฤษและการพุ่งขึ้นไปยังระดับ 200.0% Fibonacci ที่ 1.3749 แต่หากมีการยืนต่ำกว่าโซน 1.3611–1.3633 จะเพิ่มความเป็นไปได้ของการลดลงต่อเนื่องของเงินปอนด์ไปยังระดับการแก้ไข

Samir Klishi 11:15 2025-07-07 UTC+2

AUD อ่อนค่าลงเมื่อเทียบกับ USD แต่มีโอกาสที่จะฟื้นตัวกลับมาแข็งค่าชั่วคราวได้ วันจันทร์ที่ 7 กรกฎาคม 2025

AUD/USD – วันจันทร์ที่ 7 กรกฎาคม 2025 เนื่องจากความเป็นไปได้ของการยกระดับสงครามการค้าภาษีระหว่างประเทศ ความต้องการเงินสกุล USD ในฐานะเงินปลอดภัยได้เพิ่มขึ้น ทำให้วันนี้ AUD/USD อาจตกต่ำลงได้ ระดับสำคัญ

Arief Makmur 08:52 2025-07-07 UTC+2

USD แข็งค่าขึ้นอีกครั้งเมื่อเทียบกับเงินเยน แม้ว่ามีแนวโน้มที่อาจมีการปรับฐานในอนาคตอันใกล้ วันจันทร์ที่ 7 กรกฎาคม 2025

USD/JPY – วันจันทร์ที่ 7 กรกฎาคม 2025 จากการประกาศข้อมูลเศรษฐกิจของสหรัฐฯ ที่ออกมาในทางบวกร่วมกับท่าทีของ BOJ ที่ยังคงนโยบายแบบผ่อนคลายอยู่ วันนี้ USD/JPY มีศักยภาพที่จะเสริมความแข็งแกร่งขึ้น ระดับสำคัญ

Arief Makmur 08:52 2025-07-07 UTC+2

การคาดการณ์คู่สกุลเงิน EUR/USD สำหรับวันที่ 7 กรกฎาคม 2025

บนกราฟรายสัปดาห์ ราคาสามารถขึ้นไปถึงจุดตัดของ Fibonacci ray และเส้นขอบด้านบนของช่องราคาพอดี ซึ่งเกิดขึ้นบนแท่งแรกหลังจากเส้นเวลา Fibonacci ที่ 11 ซึ่งมักจะเป็นจุดเริ่มต้นของการกลับตัวของแนวโน้ม ความแตกต่างระหว่างราคาและ Marlin oscillator ยังเสริมความแข็งแกร่งให้กับสัญญาณนี้อีกด้วย ตามสถิติแล้ว

Laurie Bailey 06:24 2025-07-07 UTC+2

การคาดการณ์ GBP/USD สำหรับวันที่ 7 กรกฎาคม 2025

ในวันพฤหัสบดีและวันศุกร์ ค่าเงินปอนด์ซื้อขายในกรอบแคบระหว่างแนวรับที่ระดับ 1.3635 และแนวต้านของเส้น MACD รายวัน เช้านี้ ราคากำลังพยายามที่จะทะลุผ่านแนวรับ ขณะที่ตัวบ่งชี้ Marlin ก็พยายามที่จะเคลื่อนเข้าสู่ระดับขาลงเช่นกัน หากราคาสามารถเคลื่อนตัวต่ำกว่าระดับแนวรับได้อย่างชัดเจน จะเป็นการเปิดเส้นทางไปสู่เป้าหมายที่ 1.3414 ซึ่งเป็นจุดต่ำสุดตั้งแต่วันที่

Laurie Bailey 06:21 2025-07-07 UTC+2

การพยากรณ์ USD/JPY สำหรับวันที่ 7 กรกฎาคม 2025

USD/JPY: หลังจากที่คู่เงินนี้พุ่งสูงขึ้นถึง 126 จุด เนื่องจากข้อมูลตลาดแรงงานสหรัฐที่แข็งแกร่ง ซึ่งดันราคาให้อยู่เหนือเส้นตัวชี้วัดสมดุล แต่คู่เงินนี้ปิดต่ำกว่าเส้นดังกล่าวในวันศุกร์ วันนี้เริ่มต้นด้วยการแข็งค่าของสกุลเงินเยนญี่ปุ่นอย่างชัดเจน ซึ่งบ่งบอกว่านักลงทุนให้ความสำคัญกับปัจจัยด้านนโยบายภายในประเทศมากขึ้นอีกครั้ง ญี่ปุ่นกำลังเตรียมมาตรการตอบโต้ภาษีใหม่ 35% สำหรับสินค้าญี่ปุ่นที่ประกาศโดยทรัมป์ และธนาคารแห่งประเทศญี่ปุ่นอาจเลื่อนการปรับขึ้นอัตราดอกเบี้ยครั้งต่อไปออกไป ขณะนี้นักลงทุนยังคงมองว่าสกุลเงินเยนเป็นสินทรัพย์ที่ปลอดภัยในยามวิกฤต การที่ราคาลงต่ำกว่าแนวรับเป้าหมายที่

Laurie Bailey 06:15 2025-07-07 UTC+2

EUR/USD. วันที่ 4 กรกฎาคม หมีขยับย้ายออกจากตลาดต่อเนื่อง

เมื่อวันพฤหัสบดี คู่เงิน EUR/USD ได้ดีดตัวขึ้นอีกครั้งจากระดับ 1.1802 และลดลงเกือบถึงระดับ Fibonacci retracement 127.2% ที่ 1.1712 เช้าวันศุกร์นี้ คู่เงินนี้กำลังพยายามกลับไปยังระดับ 1.1802 การดีดตัวขึ้นอีกครั้งจากระดับนี้อาจส่งสัญญาณการกลับตัวเป็นฝั่งดอลลาร์สหรัฐฯ

Samir Klishi 10:53 2025-07-04 UTC+2

การคาดการณ์อัตราแลกเปลี่ยน 04/07/2025: EUR/USD, GBP/USD, USD/JPY, SP500 และ Bitcoin

ลิงก์ที่มีประโยชน์: บทความอื่นๆ ของฉันสามารถอ่านได้ในส่วนนี้ คอร์สสำหรับผู้เริ่มต้นของ InstaForex การวิเคราะห์ยอดนิยม เปิดบัญชีเทรด ข้อสำคัญ: ผู้เริ่มต้นในการซื้อขายฟอเร็กซ์ควรระมัดระวังเป็นพิเศษเมื่อทำการตัดสินใจเข้าสู่ตลาด ก่อนที่รายงานสำคัญจะออกมา ควรหลีกเลี่ยงการเข้าตลาดเพื่อป้องกันการจับอยู่ในความผันผวนที่รุนแรง เนื่องจากการเพิ่มขึ้นของความผันผวน หากคุณตัดสินใจที่จะซื้อขายในช่วงการประกาศข่าว ควรวางคำสั่งหยุดขาดทุนเสมอเพื่อเป็นการลดการสูญเสีย หากไม่วางคำสั่งหยุดขาดทุน

Sebastian Seliga 10:51 2025-07-04 UTC+2
หากไม่สะดวกคุยในตอนนี้
ระบุคำถามไว้ได้ใน แชท.
Widget callback
 

Dear visitor,

Your IP address shows that you are currently located in the USA. If you are a resident of the United States, you are prohibited from using the services of InstaFintech Group including online trading, online transfers, deposit/withdrawal of funds, etc.

If you think you are seeing this message by mistake and your location is not the US, kindly proceed to the website. Otherwise, you must leave the website in order to comply with government restrictions.

Why does your IP address show your location as the USA?

  • - you are using a VPN provided by a hosting company based in the United States;
  • - your IP does not have proper WHOIS records;
  • - an error occurred in the WHOIS geolocation database.

Please confirm whether you are a US resident or not by clicking the relevant button below. If you choose the wrong option, being a US resident, you will not be able to open an account with InstaForex anyway.

We are sorry for any inconvenience caused by this message.