empty
20.12.2023 06:03 AM
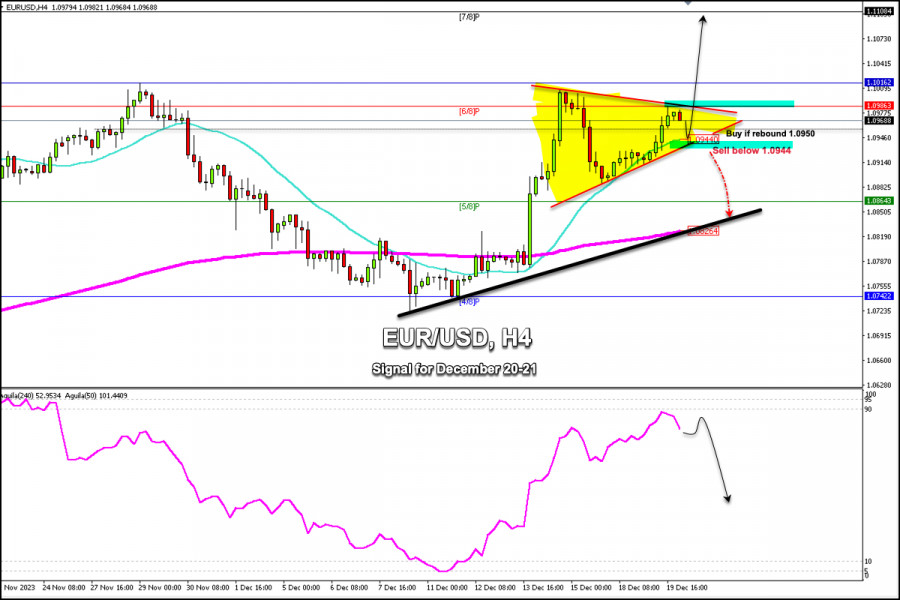
Trading Signals for EUR/USD for December 20-21, 2023: buy if rebounds at 1.0950 (21 SMA - 6/8 Murray)

This image is no longer relevant

Early during the European session, the Euro is trading above the 21 SMA and above the 200 EMA with an upside bias but showing signs of exhaustion.

During the American session yesterday, the Euro rose above the 21 SMA reaching 6/8 Murray around 1.0986.

According to the H4 chart, we can see that the euro is trading within a symmetrical triangle pattern and it is likely to continue trading between 1.0986 and 1.0944.

In case the euro breaks and consolidates above 1.0986, it could reach the psychological level of 1.10 and the November 27 high around 1.1016. If the Euro exceeds this level, it could reach 7/8 Murray at 1.1108.

On the other hand, if the euro falls below the daily pivot point at 1.0956 and consolidates below the 21 SMA at 1.0944, it could fall towards 5/8 Murray around 1.0864 and could even reach the 200 EMA at 1.0826, the level that coincides with the uptrend channel formed since December 7.

The eagle indicator is reaching overbought levels, so as long as the euro trades below the psychological level of 1.10, we could expect a technical correction. Additionally, if the Euro breaks below 1.0944, it could be the start of a decline with the target at 1.0742 (4/8 Murray).

The market sentiment report shows that there are 58.46% of traders who are selling the EUR/USD pair. According to our contrarian strategy, we expect the euro to continue to rise in the coming days and it could reach 1.1016 and 1.1108. For this scenario, we should expect a daily close above 1.1020.

Summary
Urgency
Analytic
Dimitrios Zappas
Start trade
รับผลกำไรจากการเปลี่ยนแปลงอัตราสกุลเงินดิจิทัลกับ InstaForex.
ดาวน์โหลด MetaTrader 4 และเปิดการซื้อขายครั้งแรกของคุณ.
  • Grand Choice
    Contest by
    InstaForex
    InstaForex always strives to help you
    fulfill your biggest dreams.
    เข้าร่วมการแข่งขัน


บทความแนะนำ

การคาดการณ์สำหรับ EUR/USD วันที่ 11 สิงหาคม 2025

เมื่อวันศุกร์ที่ผ่านมา EUR/USD ทำการฟื้นตัวขึ้นสองครั้งจากโซนแนวรับ 1.1637–1.1645 และหันไปในทางที่เพิ่มขึ้นของยูโร ซึ่งหมายความว่าการเคลื่อนไหวขึ้นอาจดำเนินต่อไปในวันนี้ มุ่งสู่ระดับ Fibonacci retracement ที่ 76.4% ที่ 1.1695 การคงอยู่ต่ำกว่าโซน 1.1637–1.1645

Samir Klishi 10:44 2025-08-11 UTC+2

การพยากรณ์ค่าเงิน GBP/USD สำหรับวันที่ 11 สิงหาคม 2025

ในกราฟรายชั่วโมง GBP/USD ในวันศุกร์มีการกระเด้งสองครั้งจากระดับ 1.3425 และในวันจันทร์ยังคงเคลื่อนไหวขึ้นไปสู่ระดับแนวต้านที่ 76.4% ที่ 1.3470 การกระเด้งจากระดับนี้จะเป็นผลดีต่อดอลลาร์สหรัฐและการดึงกลับไปที่ระดับ 1.3425 และโซนแนวรับที่ 1.3357–1.3371 การยืนที่ระดับเหนือ 1.3470 จะเพิ่มโอกาสให้การเติบโตต่อไปสู่ระดับ

Samir Klishi 10:25 2025-08-11 UTC+2

การคาดการณ์ตลาด Forex 11/08/2025: EUR/USD, USD/JPY, GBP/USD, Gold, Ethereum และ Bitcoin

ลิงก์ที่เป็นประโยชน์: บทความอื่น ๆ ของฉันที่มีให้ในส่วนนี้ คอร์สสำหรับผู้เริ่มต้นกับ InstaForex การวิเคราะห์ที่ได้รับความนิยม เปิดบัญชีซื้อขาย สำคัญ: ผู้เริ่มต้นในการซื้อขายฟอเร็กซ์ต้องระมัดระวังอย่างมากในการตัดสินใจเข้าสู่ตลาด ก่อนที่รายงานสำคัญจะถูกเผยแพร่ ควรหลีกเลี่ยงที่จะเข้าตลาด เพื่อหลีกเลี่ยงการเผชิญกับความผันผวนของตลาดที่สูงขึ้น หากคุณตัดสินใจที่จะซื้อขายในระหว่างการปล่อยข่าว ควรตั้งคำสั่งหยุด

Sebastian Seliga 10:20 2025-08-11 UTC+2

GBP/USD. การวิเคราะห์ทางเทคนิคสำหรับสัปดาห์ที่ 11–16 สิงหาคม

การวิเคราะห์แนวโน้ม ในสัปดาห์นี้ จากระดับ 1.3450 (ใกล้ระดับราคาปิดของเทียนสัปดาห์ก่อนหน้า) ราคามีโอกาสที่จะเริ่มเคลื่อนตัวลดลงไปทดสอบระดับ 1.3270 ซึ่งเป็นจุดระดับสนับสนุนทางประวัติศาสตร์ (เส้นประสีน้ำเงิน) เมื่อทดสอบระดับนี้แล้ว ราคามีโอกาสเคลื่อนตัวต่อไปยังระดับ 1.3141 ซึ่งเป็นระดับการถอยกลับ 38.2% (เส้นประสีแดง)

Stefan Doll 10:02 2025-08-11 UTC+2

EUR/USD. การวิเคราะห์ทางเทคนิคสำหรับสัปดาห์ที่ 11–16 สิงหาคม

การวิเคราะห์แนวโน้ม (รูปที่ 1) ในสัปดาห์นี้ จากระดับ 1.1641 (ใกล้เคียงกับแท่งเทียนรายสัปดาห์ล่าสุด) ตลาดอาจเริ่มเคลื่อนไหวลงสู่ระดับ 1.1448 – แนวระดับการคืนกลับ 50% (เส้นประสีน้ำเงิน) เมื่อทดสอบระดับนี้ ราคาอาจเริ่มเคลื่อนไหวขึ้นสู่ระดับ

Stefan Doll 09:55 2025-08-11 UTC+2

GBP/USD: การวิเคราะห์ตัวบ่งชี้ในวันที่ 11 สิงหาคม 2025

การวิเคราะห์แนวโน้ม (รูปที่ 1) ในวันจันทร์ ตั้งแต่ระดับ 1.3450 (จากการปิดของแท่งเทียนประจำวันในวันศุกร์) ตลาดอาจมีการเคลื่อนไหวขึ้นต่อไปที่ระดับ 1.3481 ซึ่งเป็นระดับการปรับฐาน 76.4% (เส้นประสีแดง) เมื่อทดสอบระดับนี้แล้ว ราคาอาจเริ่มมีการเคลื่อนไหวลงมาที่ระดับ 1.3416

Stefan Doll 09:53 2025-08-11 UTC+2

EUR/USD. การวิเคราะห์ตัวชี้วัดเมื่อวันที่ 11 สิงหาคม 2025

การวิเคราะห์แนวโน้ม (รูปที่ 1) ในวันจันทร์ จากระดับ 1.1641 (ระดับปิดของกราฟเทียนในวันศุกร์) ตลาดอาจเริ่มเคลื่อนไหวขึ้นไปยัง 1.1689 ซึ่งเป็นระดับแนวต้านทางประวัติศาสตร์ (เส้นประสีน้ำเงิน) เมื่อทดสอบระดับนี้ ราคามีแนวโน้มที่จะเริ่มเคลื่อนตัวลงไปที่ 1.1653 ซึ่งเป็นระดับการย้อนกลับ

Stefan Doll 09:40 2025-08-11 UTC+2

หาก USD/JPY สามารถทะลุระดับ Pivot ได้สำเร็จ ก็มีโอกาสที่จะปรับตัวแข็งแกร่งขึ้นต่อไป วันจันทร์ที่ 11 สิงหาคม 2025

[USD/JPY] – [วันจันทร์ที่ 11 สิงหาคม 2025] แม้ว่าสถานการณ์ของ USD/JPY ยังเคลื่อนไหวในทิศทางด้านข้าง (Sideways) ดังที่ชี้ให้เห็นโดยค่า EMA ที่ซ้อนทับกัน การที่ USD/JPY

Arief Makmur 07:37 2025-08-11 UTC+2

NZD/USD ยังคงมีโอกาสในการแข็งค่าไปยังระดับแนวต้านที่ใกล้ที่สุดได้ต่อไป วันจันทร์ที่ 11 สิงหาคม 2025

[NZD/USD] – [วันจันทร์ที่ 11 สิงหาคม 2025] เมื่อตัวชี้วัดค่าเฉลี่ยเคลื่อนที่เอ็กซ์โพเนนเชียล (EMA) ทั้งสองแนวเกิดเป็น Golden Cross และ RSI(14) อยู่ในระดับ Neutral

Arief Makmur 07:37 2025-08-11 UTC+2

การคาดการณ์ค่าเงิน EUR/USD สำหรับวันที่ 11 สิงหาคม 2025

ยูโรได้ตั้งฐานแน่นยิ่งขึ้นที่ระดับสนับสนุน 1.1632 และยิ่งอยู่ที่นั่นนานเท่าไร ความสมดุลระหว่างโอกาสการเติบโตและการลดลงจะยิ่งชัดเจนยิ่งขึ้น อย่างไรก็ตาม มีสองปัจจัยที่ส่งผลต่อโครงสร้างที่เป็นกลางนี้และเพิ่มโอกาสสำหรับฝั่งหมีอย่างช้าๆ: เส้นเวลา Fibonacci หมายเลข 8 ที่เข้าใกล้มากขึ้นทุกครั้งที่มีแท่งเทียนใหม่ และเครื่องมือ Marlin oscillator ซึ่งเมื่ออยู่ในสถานะที่ราคาขยับด้านข้าง

Laurie Bailey 05:01 2025-08-11 UTC+2
หากไม่สะดวกคุยในตอนนี้
ระบุคำถามไว้ได้ใน แชท.
Widget callback
 

Dear visitor,

Your IP address shows that you are currently located in the USA. If you are a resident of the United States, you are prohibited from using the services of InstaFintech Group including online trading, online transfers, deposit/withdrawal of funds, etc.

If you think you are seeing this message by mistake and your location is not the US, kindly proceed to the website. Otherwise, you must leave the website in order to comply with government restrictions.

Why does your IP address show your location as the USA?

  • - you are using a VPN provided by a hosting company based in the United States;
  • - your IP does not have proper WHOIS records;
  • - an error occurred in the WHOIS geolocation database.

Please confirm whether you are a US resident or not by clicking the relevant button below. If you choose the wrong option, being a US resident, you will not be able to open an account with InstaForex anyway.

We are sorry for any inconvenience caused by this message.