empty
15.01.2024 11:30 AM
Weekly forecast based on simplified wave analysis for GBP/USD, AUD/USD, USD/CHF, EUR/JPY, AUD/JPY, and US dollar index from January 15th

GBP/USD

Analysis:

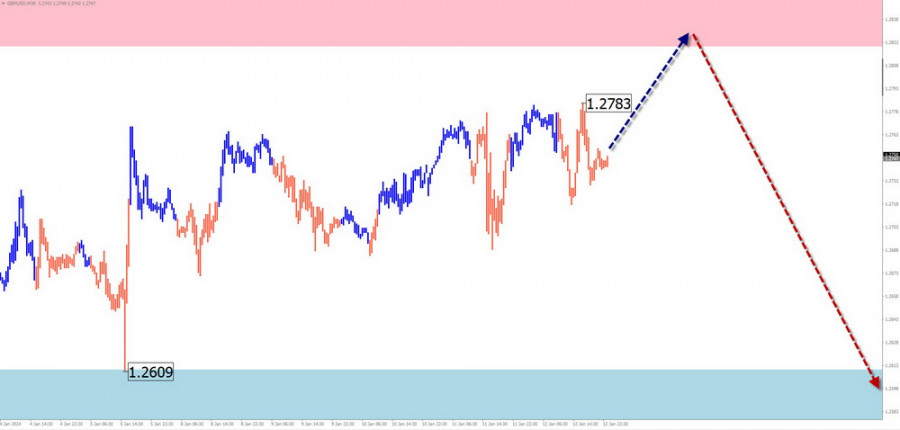
On the chart of the major British pound currency pair, the trend direction has been set by an ascending wave algorithm since October last year. The last segment of this wave, which has been correcting the main direction since late November, takes the form of a shifting plane. Its structure still needs to be completed. Quotes are trading in a narrow corridor between zones of opposing directions.

Forecast:

In the first half of the week, a sideways movement with an ascending vector is expected for the British pound. An increase in the exchange rate is possible but within the calculated resistance. Further, in this zone, one can expect increased volatility, a change in direction, and a return to the bearish direction.

This image is no longer relevant

Potential Reversal Zones

Resistance:

  • 1.2820/1.2870

Support:

  • 1.2610/1.2560

Recommendations:

Purchases: Have a limited potential and may result in losses.

Sales: After the appearance of confirmed reversal signals in the resistance area by your trading system, they may be used in trading transactions.

AUD/USD

Analysis:

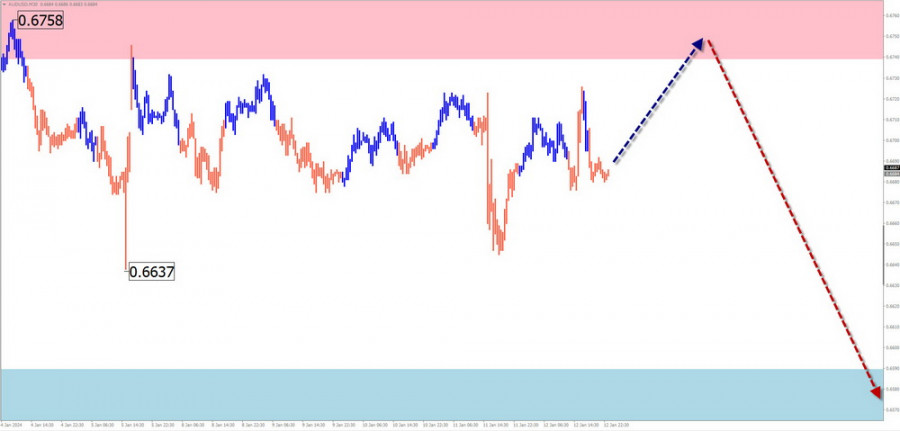
On the chart of the Australian currency in pairs against the US dollar, the most interesting feature is the unfinished ascending wave pattern from October 13th of last year. In its structure, the middle part (B) is nearing completion. On the chart, this segment looks like a stretched plane. Quotes of the pair are trapped between reversal potential zones of different timeframes.

Forecast:

Over the next few days, a general ascending vector is expected, with the price returning to the calculated resistance. After possible pressure on this zone, a reversal can be expected. The start of a bearish trend is likely by the end of the week. The decline is likely not beyond the support zone.

This image is no longer relevant

Potential Reversal Zones

Resistance:

  • 0.6740/0.6790

Support:

  • 0.6590/0.6540

Recommendations:

Purchases: Due to limited potential, they may result in losses.

Sales: After confirmed reversal signals appear in the resistance area, fractional lot sizes may be used in trading transactions.

USD/CHF

Analysis:

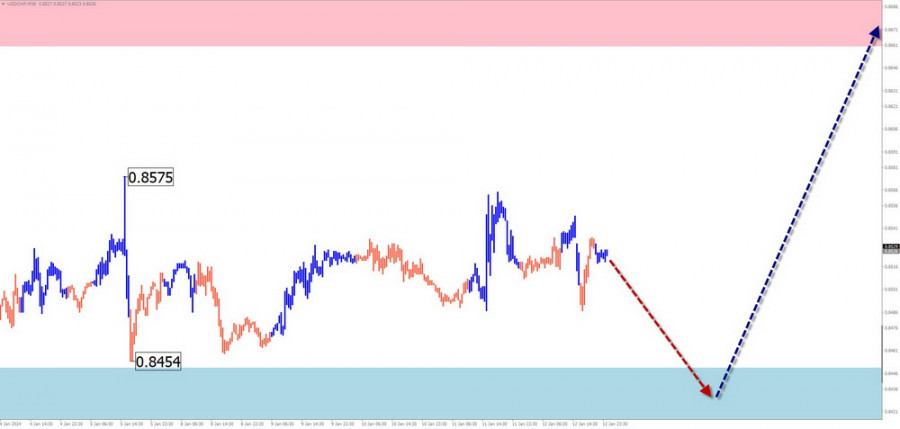
The quotes of the Swiss franc on the chart of the major pair continue to form a descending plane. In its structure, the final part (C) has been developing since the end of December. A horizontal correction has been forming within this segment for the past two months. The structure of this movement is not complete at the time of analysis.

Forecast:

In the upcoming week, the continuation of the overall sideways movement is expected. In the first few days, the completion of the descending sentiment can be expected. Afterward, a reversal and an upward movement are anticipated. When changing direction, a brief breakthrough of the lower boundary of the support zone cannot be ruled out.

This image is no longer relevant

Potential Reversal Zones

Resistance:

  • 0.8660/0.8710

Support:

  • 0.8450/0.8400

Recommendations:

Sales: There are no conditions for such transactions in the pair market.

Purchases: After confirmed reversal signals appear in the support area, they may be used in trading. It is safer to reduce the trading lot size.

EUR/JPY

Analysis:

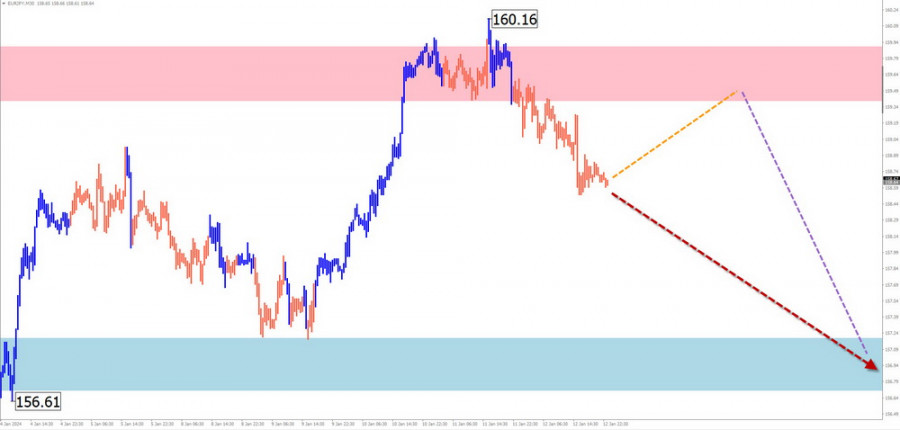
Since the end of December last year, an ascending wave structure has been developing on the chart of the euro/yen pair. This wave forms a new segment of the main trend on the weekly chart. Quotes have reached the lower boundary of a powerful potential reversal zone. There is a need for a correction in the structure.

Forecast:

Over the upcoming week, a continuation of the price decline is expected, with a decrease in the exchange rate to the calculated support. In the first couple of days, a short-term increase in price is not ruled out, but not beyond the calculated resistance.

This image is no longer relevant

Potential Reversal Zones

Resistance:

  • 159.40/159.90

Support:

  • 157.20/156.70

Recommendations:

Purchases: Due to expected limited potential, they may be risky.

Sales: After confirmed reversal signals appear in the support area, they may be used to execute transactions.

AUD/JPY

Brief Analysis:

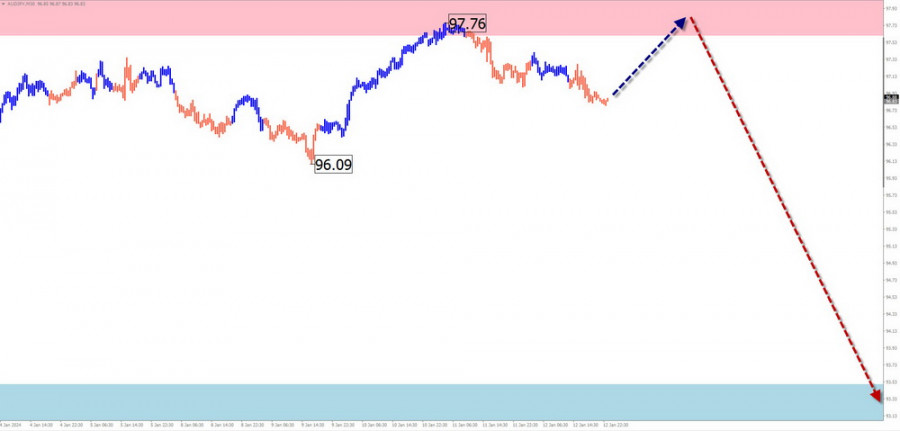
The trend of the Australian dollar/Japanese yen pair has increased in recent years. The unfinished segment in the short-term perspective is a correction, counting from the middle of June of last year. Its structure is nearing completion at the time of analysis. Quotes of the pair are caught between potential reversal levels of different scales.

Weekly Forecast:

Over the next couple of days, a renewed pressure on the resistance zone is possible. In the second half of the week, a reversal formation and a downward price movement can be expected, potentially down to support levels.

This image is no longer relevant

Potential Reversal Zones

Resistance:

  • 97.60/92.10

Support:

  • 93.50/93.00

Recommendations:

Purchases: Have limited potential and may result in losses.

Sales: This will be possible after confirmed reversal signals appear in the resistance area.

US Dollar Index

Brief Analysis:

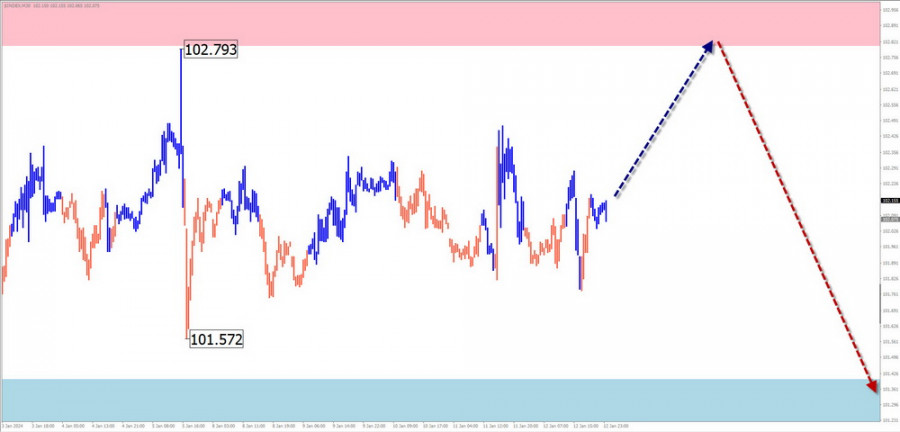
On the US Dollar Index chart, the descending wave that began in October of last year continues to dominate. Since mid-December, quotes have been corrected, forming an elongated plane. The structure of this correction is not complete at the time of analysis.

Weekly Forecast:

In the upcoming weekly period, a continuation of the overall sideways movement of the index is expected. In the first few days, a short-term rebound in resistance cannot be ruled out. A downward vector is more likely closer to the weekend.

This image is no longer relevant

Potential Reversal Zones

Resistance:

  • 102.80/103.00

Support:

  • 101.40/101.20

Recommendations:

There are no conditions for buying the US dollar in the coming week. During the weakening of the dollar's positions, profitable trades will strengthen the positions of national currencies in major pairs.

Explanations: In simplified wave analysis (SWA), all waves consist of 3 parts (A-B-C). The analysis focuses on the latest unfinished wave in each timeframe. Dashed lines indicate expected movements.

Note: The wave algorithm does not consider the duration of instrument movements in time!

Summary
Urgency
Analytic
Vyacheslav Ognev
Start trade
รับผลกำไรจากการเปลี่ยนแปลงอัตราสกุลเงินดิจิทัลกับ InstaForex.
ดาวน์โหลด MetaTrader 4 และเปิดการซื้อขายครั้งแรกของคุณ.
กลยุทธ์การซื้อขายระหว่างวันสำหรับนักเทรดมือใหม่ในวันที่ 12 สิงหาคม ค่าเงินยูโรและปอนด์ยังคงลดลง ซึ่งมีแนวโน้มว่าจะเกี่ยวข้องกับการทำกำไรจากสถานะซื้อยาวก่อนที่จะมีข้อมูลสำคัญมากกว่าการที่ดอลลาร์สหรัฐจะแข็งค่าขึ้นโดยทั่วไป ในกรณีที่ไม่มีข้อมูลจากสหรัฐ ดอลลาร์สามารถแข็งค่าขึ้นเมื่อเทียบกับยูโรและปอนด์เมื่อวานนี้ แต่การเติบโตนี้ยังคงเล็กน้อยและยังไม่เปลี่ยนแปลงดุลยภาพในตลาดอย่างมีนัยสำคัญ ดูเหมือนว่าผู้ค้ามุ่งความสนใจไปที่ความมั่นคงของเศรษฐกิจสหรัฐในระยะสั้นอย่างน้อย ในทางกลับกัน ค่าเงินยูโรอยู่ภายใต้แรงกดดันเนื่องจากความกังวลเกี่ยวกับการเติบโตทางเศรษฐกิจในภูมิภาค อย่างไรก็ตาม การขาดข้อมูลหลักจากสหรัฐเป็นเพียงปัจจัยชั่วคราว และตัวชี้วัดเศรษฐกิจในอนาคตอาจเปลี่ยนแปลงพลวัตของคู่สกุลเงินในปัจจุบัน วันนี้คาดว่าตัวเลขดัชนี ZEW Economic Sentiment
  • Grand Choice
    Contest by
    InstaForex
    InstaForex always strives to help you
    fulfill your biggest dreams.
    เข้าร่วมการแข่งขัน


บทความแนะนำ

การวิเคราะห์ GBP/USD ประจำวันที่ 11 สิงหาคม 2025

รูปแบบคลื่นสำหรับ GBP/USD ยังคงบ่งชี้ถึงการก่อตัวของโครงสร้างคลื่นเข้มข้นที่กำลังขึ้น รูปแบบคลื่นนั้นเกือบจะเหมือนกับของ EUR/USD เพราะว่า "ปัจจัยที่ขับเคลื่อน" มีเพียงแค่ค่าเงินดอลลาร์สหรัฐ ความต้องการดอลลาร์ลดลงในตลาดช่วงกลาง ดังนั้นเครื่องมือหลายอย่างจึงแสดงถึงพลวัตที่เกือบเหมือนกัน ณ ขณะนี้ คาดว่าคลื่นที่ 4 น่าจะเสร็จสิ้นแล้ว

Chin Zhao 20:43 2025-08-11 UTC+2

การวิเคราะห์ EUR/USD ประจำวันที่ 11 สิงหาคม 2025

รูปแบบคลื่นบนกราฟ 4 ชั่วโมงสำหรับคู่เงิน EUR/USD ยังคงไม่เปลี่ยนแปลงมาหลายเดือนแล้ว, ซึ่งถือเป็นสัญญาณบวก แม้ในช่วงที่เกิดการสร้างคลื่นการแก้ไข โครงสร้างยังคงถูกรักษาไว้ ทำให้สามารถทำการคาดการณ์ที่แม่นยำได้ ต้องบอกว่ารูปแบบคลื่นไม่ใช่จะต้องดูเหมือนตัวอย่างในตำราทุกครั้งไป ส่วนที่เป็นขาขึ้นของแนวโน้มยังคงพัฒนาไป โดยมีพื้นฐานข่าวที่โดยทั่วไปสนับสนุนสกุลเงินที่ไม่ใช่ดอลลาร์สหรัฐฯ สงครามการค้าที่ริเริ่มโดย Donald Trump

Chin Zhao 19:41 2025-08-11 UTC+2

การวิเคราะห์ EUR/USD วันที่ 8 สิงหาคม 2025

รูปแบบเวฟในกราฟ 4 ชั่วโมงของ EUR/USD ยังคงไม่เปลี่ยนแปลงเป็นเวลาหลายเดือน ซึ่งเป็นสัญญาณที่ดีมาก แม้ว่าเวฟการแก้ไขจะกำลังก่อตัว แต่โครงสร้างโดยรวมยังคงไม่สลาย ซึ่งสิ่งนี้ทำให้สามารถคาดการณ์ได้อย่างแม่นยำ ควรสังเกตว่ารูปแบบเวฟไม่ได้มีลักษณะเหมือนกับตัวอย่างในตำราเสมอไป การก่อตัวของส่วนแนวโน้มขาขึ้นกำลังดำเนินต่อไป ในขณะที่ข่าวหลายอย่างไม่ได้สนับสนุนค่าเงินดอลลาร์ สงครามการค้าที่เริ่มโดย Donald Trump

Chin Zhao 20:59 2025-08-08 UTC+2

การวิเคราะห์ GBP/USD ประจำวันที่ 7 สิงหาคม 2025

รูปแบบคลื่นสำหรับ GBP/USD ยังคงบ่งบอกถึงการก่อตัวของรูปแบบคลื่นที่พุ่งขึ้น รูปแบบคลื่นเกือบจะเหมือนกับ EUR/USD เนื่องจาก “ตัวขับเคลื่อนหลัก” เพียงอย่างเดียวคือดอลลาร์สหรัฐ ความต้องการดอลลาร์ในระยะกลางกำลังลดลงทั่วตลาด ดังนั้นเครื่องมือหลายชนิดจึงแสดงไดนามิกส์ที่เหมือนกัน ปัจจุบัน ชุดคลื่นแก้ไขภายในคลื่นลูกที่ 4 กำลังคลี่คลาย หากข้อตั้งนี้ถูกต้อง

Chin Zhao 20:18 2025-08-07 UTC+2

การวิเคราะห์ EUR/USD ประจำวันที่ 7 สิงหาคม 2025

รูปแบบคลื่นในกราฟ 4 ชั่วโมงของ EUR/USD ยังคงไม่เปลี่ยนแปลงมาหลายเดือน ซึ่งเป็นสัญญาณที่ดี แม้มีการก่อตัวของคลื่นแก้ไข โครงสร้างโดยรวมก็ยังไม่ถูกทำลาย ทำให้สามารถทำนายได้อย่างแม่นยำ ควรจำไว้ว่ารูปแบบคลื่นไม่ได้ต้องเหมือนตามตำราเสมอไป ทิศทางแนวโน้มกำลังขึ้น ยังคงพัฒนาต่อไป และข่าวส่วนใหญ่ก็สนับสนุนสกุลเงินอื่นนอกจากดอลลาร์ สงครามการค้าที่ริเริ่มโดย Donald

Chin Zhao 20:14 2025-08-07 UTC+2

การวิเคราะห์ GBP/USD เมื่อวันที่ 6 สิงหาคม 2025

รูปแบบคลื่นสำหรับ GBP/USD ยังคงบ่งบอกถึงการพัฒนาในโครงสร้างบูลลิชอิมพัลส์ หรือทิศทางขาขึ้น โครงสร้างคลื่นนี้แทบจะเหมือนกับของ EUR/USD เพราะว่าตัวขับเคลื่อนหลักในที่นี้คือค่าเงินดอลลาร์สหรัฐ ความต้องการในค่าเงินดอลลาร์สหรัฐลดลงทั่วทั้งตลาด (ในระยะกลาง) ซึ่งเป็นเหตุผลว่าทำไมเครื่องมือการลงทุนมากมายจึงแสดงพฤติกรรมแบบเดียวกัน ปัจจุบัน คลื่นปรับฐานภายในคลื่นที่ 4 กำลังถูกสร้างขึ้น หากสมมุติฐานนี้ถูกต้อง

Chin Zhao 21:55 2025-08-06 UTC+2

การวิเคราะห์ EUR/USD วันที่ 6 สิงหาคม 2025

รูปแบบคลื่นบนกราฟ 4 ชั่วโมงสำหรับคู่เงิน EUR/USD ยังคงไม่เปลี่ยนแปลงมาหลายเดือนแล้ว ซึ่งนับว่าเป็นสัญญาณที่ดี แม้กระทั่งในระหว่างการสร้างคลื่นปรับฐาน โครงสร้างก็ยังคงไม่เปลี่ยนแปลง ช่วยให้สามารถทำนายได้อย่างแม่นยำ ควรทราบว่ารูปแบบคลื่นไม่จำเป็นต้องเป็นไปตามตำราที่เรียนมาทุกครั้ง การสร้างช่วงแนวโน้มขาขึ้นยังคงดำเนินต่อไป และข้อมูลข่าวสารโดยรวมดูเหมือนจะเป็นปัจจัยบวกต่อดอลลาร์สหรัฐฯ จากการที่สงครามการค้าที่ Donald Trump

Chin Zhao 21:51 2025-08-06 UTC+2

การวิเคราะห์ GBP/USD ในวันที่ 4 สิงหาคม 2025

รูปแบบคลื่นสำหรับคู่เงิน GBP/USD ยังคงบ่งชี้ถึงการก่อตัวของโครงสร้างคลื่นที่เป็นแนวโน้มขึ้น รูปแบบคลื่นคล้ายกับ EUR/USD อย่างมาก เนื่องจาก "ตัวขับเคลื่อน" ที่สำคัญในช่วงนี้ยังคงเป็นดอลลาร์สหรัฐ ความต้องการดอลลาร์กำลังลดลงในตลาดกว้าง (ในระยะกลาง) นั่นคือเหตุผลที่หลายๆ เครื่องมือแสดงรูปแบบการเคลื่อนไหวที่เกือบเหมือนกัน ขณะนี้ลำดับคลื่นการปรับฐานครั้งที่

Chin Zhao 22:02 2025-08-04 UTC+2

การวิเคราะห์ EUR/USD ประจำวันที่ 4 สิงหาคม 2025

รูปแบบของคลื่นบนกราฟ 4 ชั่วโมงของคู่สกุลเงิน EUR/USD ยังคงไม่มีการเปลี่ยนแปลงเป็นเวลาหลายเดือน ซึ่งส่งผลให้เกิดความรู้สึกดีๆ แม้ในช่วงที่ตลาดมีการแก้ไขโครงสร้าง โครงสร้างก็ยังคงอยู่เพื่อให้สามารถคาดคะเนได้อย่างแม่นยำ ควรทราบว่าโครงสร้างของคลื่นไม่ได้ดูดีตามตำราเสมอไป การก่อตัวของช่วงแนวโน้มขาขึ้นยังคงดำเนินต่อไป และข่าวพื้นฐานส่วนใหญ่ยังคงไม่สนับสนุนดอลลาร์ สงครามการค้าที่ Donald Trump เริ่มขึ้นมีเป้าหมายเพื่อเพิ่มรายได้งบประมาณและกำจัดการขาดดุลการค้า

Chin Zhao 21:58 2025-08-04 UTC+2

การคาดการณ์รายสัปดาห์ตามการวิเคราะห์คลื่นแบบง่าย สำหรับ GBP/USD, AUD/USD, USD/CHF, EUR/JPY, AUD/JPY, EUR/CHF, และ ดัชนีดอลลาร์สหรัฐ – วันที่ 4 สิงหาคม

GBP/USD การวิเคราะห์: ตั้งแต่ต้นปีที่ผ่านมา เงินปอนด์อังกฤษมีแนวโน้มเคลื่อนไหวในทิศทางขึ้น ตั้งแต่กลางเดือนกรกฎาคม คู่สกุลเงินนี้มีการซื้อขายในลักษณะออกข้างใกล้กับโซนแนวต้าน ซึ่งเป็นการแก้ไขระดับกลาง ในตอนนี้การปรับลดนี้ดูเหมือนจะเสร็จสิ้นแล้ว ส่วนขาขึ้นที่เริ่มเมื่อวันที่ 1 สิงหาคมน่าจะเป็นเพียงแค่การปรับฐานเท่านั้น การพยากรณ์: แนวโน้มการลดลงคาดว่าจะสิ้นสุดลงในสัปดาห์นี้ โดยมีแนวโน้มที่จะเกิดการกลับตัวและการเติบโตอีกครั้งใกล้กับโซนแนวรับ ช่วงราคาประจำสัปดาห์ถูกกำหนดโดยโซนการกลับตัวที่อยู่ใกล้เคียง

Isabel Clark 10:07 2025-08-04 UTC+2
หากไม่สะดวกคุยในตอนนี้
ระบุคำถามไว้ได้ใน แชท.
Widget callback
 

Dear visitor,

Your IP address shows that you are currently located in the USA. If you are a resident of the United States, you are prohibited from using the services of InstaFintech Group including online trading, online transfers, deposit/withdrawal of funds, etc.

If you think you are seeing this message by mistake and your location is not the US, kindly proceed to the website. Otherwise, you must leave the website in order to comply with government restrictions.

Why does your IP address show your location as the USA?

  • - you are using a VPN provided by a hosting company based in the United States;
  • - your IP does not have proper WHOIS records;
  • - an error occurred in the WHOIS geolocation database.

Please confirm whether you are a US resident or not by clicking the relevant button below. If you choose the wrong option, being a US resident, you will not be able to open an account with InstaForex anyway.

We are sorry for any inconvenience caused by this message.