empty
11.11.2024 12:31 PM
Weekly Forecast Based on Simplified Wave Analysis for EUR/USD, USD/JPY, GBP/JPY, USD/CAD, NZD/USD, EUR/GBP, Gold, and Bitcoin for November 11

EUR/USD

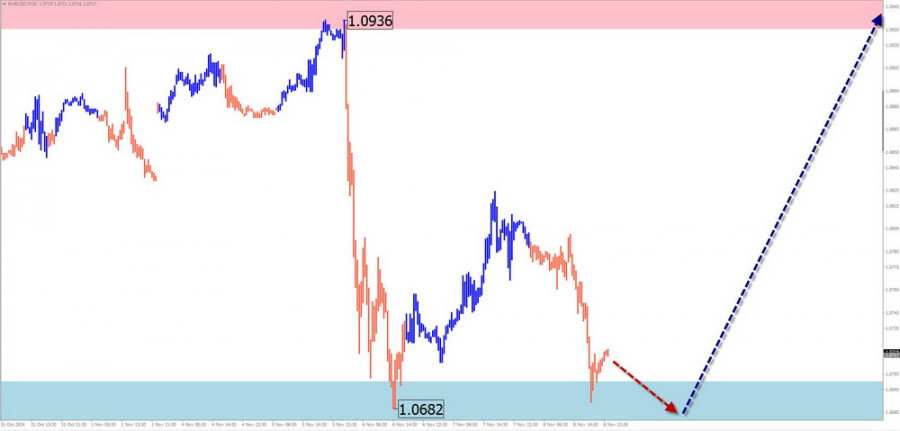
Analysis: The short-term wave structure is downward, representing a correction within the primary trend. This wave started in late August and remains incomplete. While the structure appears mature, no signals of an imminent reversal are currently observed. The price has reached the upper boundary of the preliminary target zone for the current wave.

Forecast: The euro is expected to move sideways during the upcoming week. Temporary pressure near the support level may occur in the next couple of days. A potential reversal and growth toward the lower boundary of the resistance zone could follow. An increase in volatility is likely in the latter half of the week.

This image is no longer relevant

Potential Reversal Zones:

  • Resistance: 1.0930/1.0980
  • Support: 1.0700/1.0650

Recommendations:

  • Buy: Consider buying after confirmed signals near the support zone.
  • Sell: Selling lacks potential and could result in losses.

USD/JPY

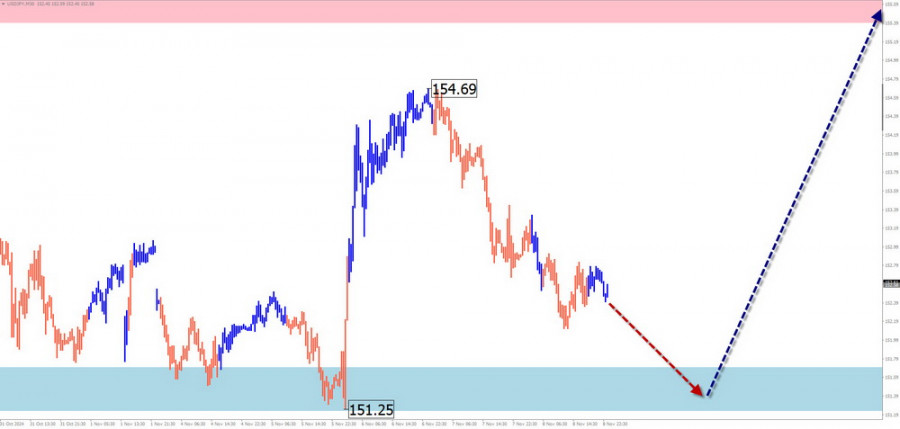
Analysis: The weakening of the yen against the U.S. dollar has been evident since early August. The pair has reached a potential reversal zone on the weekly timeframe. The corrective wave, initiated in early October, remains incomplete. The downward movement starting November 6 concludes the correction but has not fully completed at the time of analysis.

Forecast: Further decline is likely early in the week, followed by sideways movement near the support zone. A reversal and resumption of price growth are expected later in the week, with the upward movement constrained by calculated resistance levels.

This image is no longer relevant

Potential Reversal Zones:

  • Resistance: 155.40/155.90
  • Support: 151.70/151.20

Recommendations:

  • Buy: Consider buying after appropriate signals appear near the support zone.
  • Sell: Selling is risky due to low potential; reduce volume sizes.

GBP/JPY

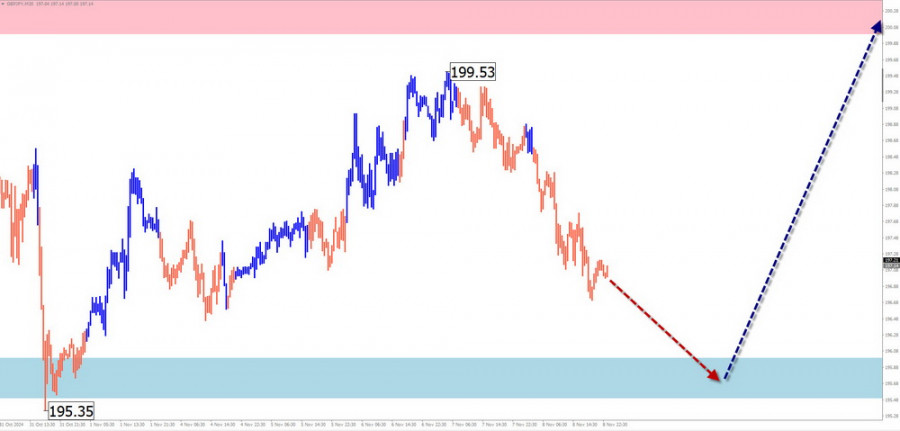
Analysis: The short-term chart for GBP/JPY shows a dominant upward trend over the past few months. The current wave segment, which began on September 11, remains incomplete. Over the past three weeks, the pair has formed a horizontal correction (Wave B), which has not yet concluded.

Forecast: Sideways movement with a downward bias is likely during the early part of the week, potentially testing the lower boundary of the support zone. A reversal and subsequent price growth are expected later in the week, potentially reaching the resistance zone.

This image is no longer relevant

Potential Reversal Zones:

  • Resistance: 200.00/200.50
  • Support: 196.00/195.50

Recommendations:

  • Sell: Sales have low potential; consider reducing volume sizes.
  • Buy: Suitable after reversal signals appear in your trading systems.

USD/CAD

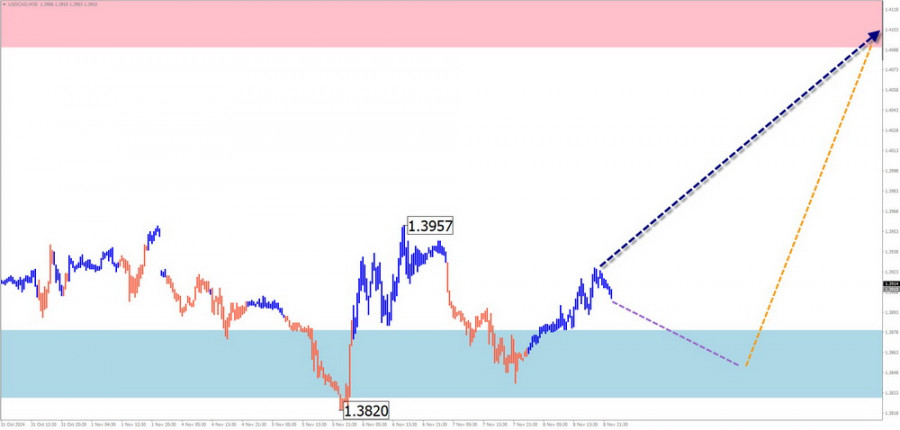
Analysis: USD/CAD continues to develop an upward wave that began in September. The counter-trend wave from November 6 is corrective and lacks reversal potential. This segment of the wave remains incomplete and coincides with the potential reversal zone on the daily timeframe.

Forecast: Sideways movement is expected for the next few days, with potential reversal conditions forming near the support zone. A directional change is likely by the weekend, with resistance levels indicating the upper boundary of the anticipated weekly range.

This image is no longer relevant

Potential Reversal Zones:

  • Resistance: 1.4090/1.4140
  • Support: 1.3880/1.3830

Recommendations:

  • Buy: Consider buying after confirmed signals in your trading systems.
  • Sell: Selling is risky and may result in losses.

NZD/USD

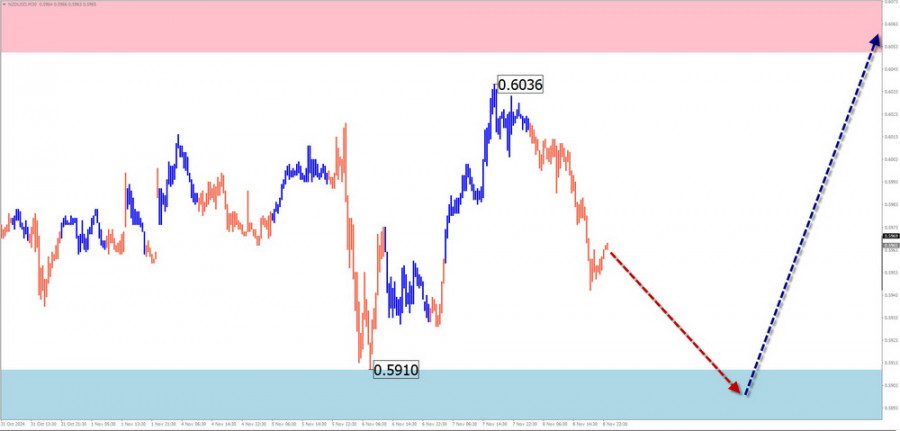
Analysis: Since late August, the NZD/USD chart has displayed a downward horizontal wave structure resembling an extended flat. The wave remains incomplete, and the price is approaching the upper boundary of the weekly potential reversal zone.

Forecast: The downward trajectory is likely to continue this week, with sideways consolidation possible early in the week. A reversal and increased volatility are expected near the calculated support zone, with potential penetration of the lower boundary.

This image is no longer relevant

Potential Reversal Zones:

  • Resistance: 0.6050/0.6100
  • Support: 0.5910/0.5860

Recommendations:

  • Sell: Use smaller volume sizes during individual sessions.
  • Buy: Premature until the current decline fully concludes.

EUR/GBP

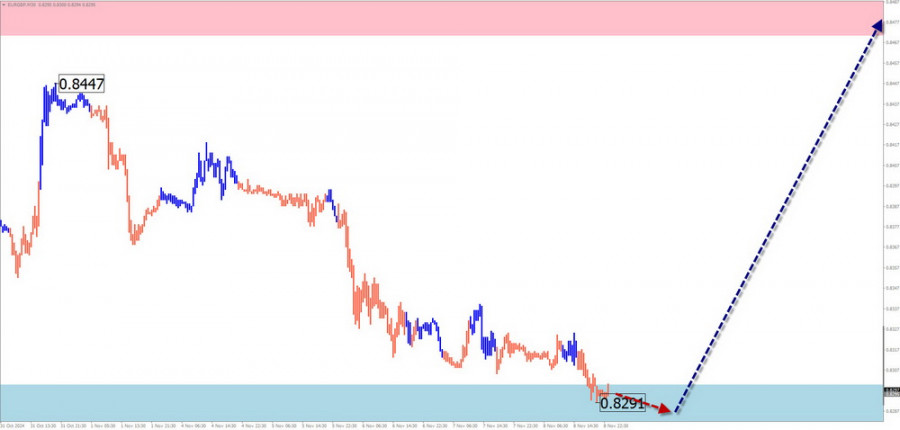
Analysis: The incomplete wave structure for EUR/GBP has been downward since August 5, forming the final segment of Wave C. The wave structure is not yet complete, and the pair has reached the upper limit of the weekly potential reversal zone.

Forecast: Sideways movement is expected over the next few days. A direct break below the support zone is unlikely. Toward the end of the week, increased volatility may signal a reversal and the start of upward movement.

This image is no longer relevant

Potential Reversal Zones:

  • Resistance: 0.8470/0.8520
  • Support: 0.8300/0.8250

Recommendations:

  • Buy: Suitable after reversal signals appear near the support zone.
  • Sell: Use smaller volume sizes during individual trading sessions.

Gold

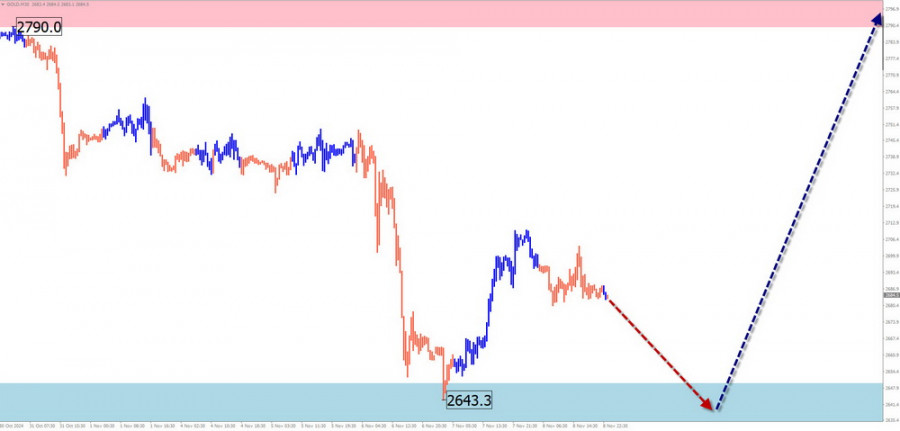
Analysis: The current wave structure for gold is upward, starting on October 3. Over the past three weeks, a horizontal correction (Wave B) has developed near strong resistance, which remains incomplete at the time of analysis.

Forecast: The downward movement is expected to conclude in the next few days, with sideways consolidation forming near the support zone. Price growth is likely to resume by the end of the week, with resistance levels indicating the upper boundary of the weekly range.

This image is no longer relevant

Potential Reversal Zones:

  • Resistance: 2790.0/2840.0
  • Support: 2650.0/2600.0

Recommendations:

  • Buy: High risk; trades may result in losses.
  • Sell: Consider selling after reversal signals appear near resistance.

Bitcoin

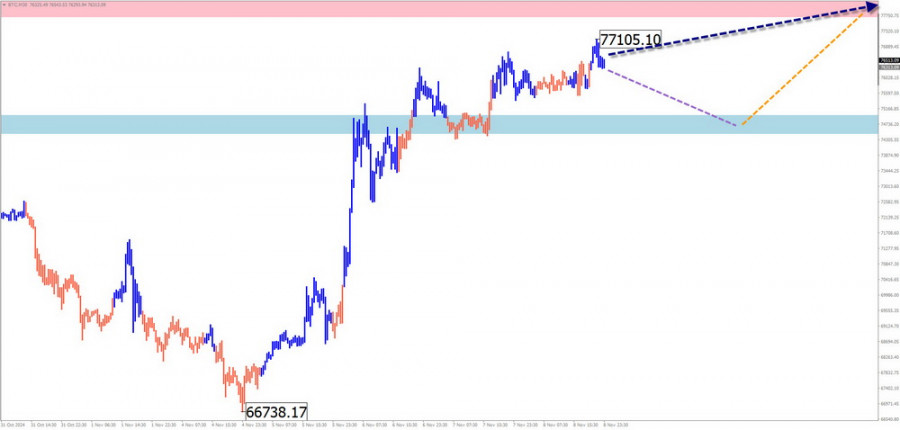
Analysis: Bitcoin's ongoing upward wave structure has been developing since August 5, indicating the start of another segment of the bullish trend. The price has reached the lower boundary of the weekly potential reversal zone.

Forecast: Bitcoin is expected to continue rising over the next few days, potentially testing the calculated resistance levels. A breakout beyond the upper boundary is unlikely. By the end of the week, increased volatility may lead to a reversal and renewed downward movement.

This image is no longer relevant

Potential Reversal Zones:

  • Resistance: 77730.0/77930.0
  • Support: 75000.0/74800.0

Recommendations:

  • Sell: Suitable after reversal signals appear near resistance.
  • Buy: Use smaller volume sizes during individual sessions.

Note: Simplified Wave Analysis (SWA) interprets waves as consisting of three parts (A-B-C). The analysis focuses on the most recent incomplete wave on each timeframe. Dotted lines indicate expected movements.

Disclaimer: Wave algorithms do not account for the duration of movements over time.

Summary
Urgency
Analytic
Vyacheslav Ognev
Start trade
รับผลกำไรจากการเปลี่ยนแปลงอัตราสกุลเงินดิจิทัลกับ InstaForex.
ดาวน์โหลด MetaTrader 4 และเปิดการซื้อขายครั้งแรกของคุณ.
  • Grand Choice
    Contest by
    InstaForex
    InstaForex always strives to help you
    fulfill your biggest dreams.
    เข้าร่วมการแข่งขัน


บทความแนะนำ

การวิเคราะห์ EUR/USD วันที่ 8 สิงหาคม 2025

รูปแบบเวฟในกราฟ 4 ชั่วโมงของ EUR/USD ยังคงไม่เปลี่ยนแปลงเป็นเวลาหลายเดือน ซึ่งเป็นสัญญาณที่ดีมาก แม้ว่าเวฟการแก้ไขจะกำลังก่อตัว แต่โครงสร้างโดยรวมยังคงไม่สลาย ซึ่งสิ่งนี้ทำให้สามารถคาดการณ์ได้อย่างแม่นยำ ควรสังเกตว่ารูปแบบเวฟไม่ได้มีลักษณะเหมือนกับตัวอย่างในตำราเสมอไป การก่อตัวของส่วนแนวโน้มขาขึ้นกำลังดำเนินต่อไป ในขณะที่ข่าวหลายอย่างไม่ได้สนับสนุนค่าเงินดอลลาร์ สงครามการค้าที่เริ่มโดย Donald Trump

Chin Zhao 20:59 2025-08-08 UTC+2

การวิเคราะห์ GBP/USD ประจำวันที่ 7 สิงหาคม 2025

รูปแบบคลื่นสำหรับ GBP/USD ยังคงบ่งบอกถึงการก่อตัวของรูปแบบคลื่นที่พุ่งขึ้น รูปแบบคลื่นเกือบจะเหมือนกับ EUR/USD เนื่องจาก “ตัวขับเคลื่อนหลัก” เพียงอย่างเดียวคือดอลลาร์สหรัฐ ความต้องการดอลลาร์ในระยะกลางกำลังลดลงทั่วตลาด ดังนั้นเครื่องมือหลายชนิดจึงแสดงไดนามิกส์ที่เหมือนกัน ปัจจุบัน ชุดคลื่นแก้ไขภายในคลื่นลูกที่ 4 กำลังคลี่คลาย หากข้อตั้งนี้ถูกต้อง

Chin Zhao 20:18 2025-08-07 UTC+2

การวิเคราะห์ EUR/USD ประจำวันที่ 7 สิงหาคม 2025

รูปแบบคลื่นในกราฟ 4 ชั่วโมงของ EUR/USD ยังคงไม่เปลี่ยนแปลงมาหลายเดือน ซึ่งเป็นสัญญาณที่ดี แม้มีการก่อตัวของคลื่นแก้ไข โครงสร้างโดยรวมก็ยังไม่ถูกทำลาย ทำให้สามารถทำนายได้อย่างแม่นยำ ควรจำไว้ว่ารูปแบบคลื่นไม่ได้ต้องเหมือนตามตำราเสมอไป ทิศทางแนวโน้มกำลังขึ้น ยังคงพัฒนาต่อไป และข่าวส่วนใหญ่ก็สนับสนุนสกุลเงินอื่นนอกจากดอลลาร์ สงครามการค้าที่ริเริ่มโดย Donald

Chin Zhao 20:14 2025-08-07 UTC+2

การวิเคราะห์ GBP/USD เมื่อวันที่ 6 สิงหาคม 2025

รูปแบบคลื่นสำหรับ GBP/USD ยังคงบ่งบอกถึงการพัฒนาในโครงสร้างบูลลิชอิมพัลส์ หรือทิศทางขาขึ้น โครงสร้างคลื่นนี้แทบจะเหมือนกับของ EUR/USD เพราะว่าตัวขับเคลื่อนหลักในที่นี้คือค่าเงินดอลลาร์สหรัฐ ความต้องการในค่าเงินดอลลาร์สหรัฐลดลงทั่วทั้งตลาด (ในระยะกลาง) ซึ่งเป็นเหตุผลว่าทำไมเครื่องมือการลงทุนมากมายจึงแสดงพฤติกรรมแบบเดียวกัน ปัจจุบัน คลื่นปรับฐานภายในคลื่นที่ 4 กำลังถูกสร้างขึ้น หากสมมุติฐานนี้ถูกต้อง

Chin Zhao 21:55 2025-08-06 UTC+2

การวิเคราะห์ EUR/USD วันที่ 6 สิงหาคม 2025

รูปแบบคลื่นบนกราฟ 4 ชั่วโมงสำหรับคู่เงิน EUR/USD ยังคงไม่เปลี่ยนแปลงมาหลายเดือนแล้ว ซึ่งนับว่าเป็นสัญญาณที่ดี แม้กระทั่งในระหว่างการสร้างคลื่นปรับฐาน โครงสร้างก็ยังคงไม่เปลี่ยนแปลง ช่วยให้สามารถทำนายได้อย่างแม่นยำ ควรทราบว่ารูปแบบคลื่นไม่จำเป็นต้องเป็นไปตามตำราที่เรียนมาทุกครั้ง การสร้างช่วงแนวโน้มขาขึ้นยังคงดำเนินต่อไป และข้อมูลข่าวสารโดยรวมดูเหมือนจะเป็นปัจจัยบวกต่อดอลลาร์สหรัฐฯ จากการที่สงครามการค้าที่ Donald Trump

Chin Zhao 21:51 2025-08-06 UTC+2

การวิเคราะห์ GBP/USD ในวันที่ 4 สิงหาคม 2025

รูปแบบคลื่นสำหรับคู่เงิน GBP/USD ยังคงบ่งชี้ถึงการก่อตัวของโครงสร้างคลื่นที่เป็นแนวโน้มขึ้น รูปแบบคลื่นคล้ายกับ EUR/USD อย่างมาก เนื่องจาก "ตัวขับเคลื่อน" ที่สำคัญในช่วงนี้ยังคงเป็นดอลลาร์สหรัฐ ความต้องการดอลลาร์กำลังลดลงในตลาดกว้าง (ในระยะกลาง) นั่นคือเหตุผลที่หลายๆ เครื่องมือแสดงรูปแบบการเคลื่อนไหวที่เกือบเหมือนกัน ขณะนี้ลำดับคลื่นการปรับฐานครั้งที่

Chin Zhao 22:02 2025-08-04 UTC+2

การวิเคราะห์ EUR/USD ประจำวันที่ 4 สิงหาคม 2025

รูปแบบของคลื่นบนกราฟ 4 ชั่วโมงของคู่สกุลเงิน EUR/USD ยังคงไม่มีการเปลี่ยนแปลงเป็นเวลาหลายเดือน ซึ่งส่งผลให้เกิดความรู้สึกดีๆ แม้ในช่วงที่ตลาดมีการแก้ไขโครงสร้าง โครงสร้างก็ยังคงอยู่เพื่อให้สามารถคาดคะเนได้อย่างแม่นยำ ควรทราบว่าโครงสร้างของคลื่นไม่ได้ดูดีตามตำราเสมอไป การก่อตัวของช่วงแนวโน้มขาขึ้นยังคงดำเนินต่อไป และข่าวพื้นฐานส่วนใหญ่ยังคงไม่สนับสนุนดอลลาร์ สงครามการค้าที่ Donald Trump เริ่มขึ้นมีเป้าหมายเพื่อเพิ่มรายได้งบประมาณและกำจัดการขาดดุลการค้า

Chin Zhao 21:58 2025-08-04 UTC+2

การคาดการณ์รายสัปดาห์ตามการวิเคราะห์คลื่นแบบง่าย สำหรับ GBP/USD, AUD/USD, USD/CHF, EUR/JPY, AUD/JPY, EUR/CHF, และ ดัชนีดอลลาร์สหรัฐ – วันที่ 4 สิงหาคม

GBP/USD การวิเคราะห์: ตั้งแต่ต้นปีที่ผ่านมา เงินปอนด์อังกฤษมีแนวโน้มเคลื่อนไหวในทิศทางขึ้น ตั้งแต่กลางเดือนกรกฎาคม คู่สกุลเงินนี้มีการซื้อขายในลักษณะออกข้างใกล้กับโซนแนวต้าน ซึ่งเป็นการแก้ไขระดับกลาง ในตอนนี้การปรับลดนี้ดูเหมือนจะเสร็จสิ้นแล้ว ส่วนขาขึ้นที่เริ่มเมื่อวันที่ 1 สิงหาคมน่าจะเป็นเพียงแค่การปรับฐานเท่านั้น การพยากรณ์: แนวโน้มการลดลงคาดว่าจะสิ้นสุดลงในสัปดาห์นี้ โดยมีแนวโน้มที่จะเกิดการกลับตัวและการเติบโตอีกครั้งใกล้กับโซนแนวรับ ช่วงราคาประจำสัปดาห์ถูกกำหนดโดยโซนการกลับตัวที่อยู่ใกล้เคียง

Isabel Clark 10:07 2025-08-04 UTC+2

การพยากรณ์รายสัปดาห์ตามการวิเคราะห์คลื่นแบบย่อสำหรับ EUR/USD, USD/JPY, GBP/JPY, USD/CAD, NZD/USD, EUR/GBP และทองคำ – วันที่ 4 สิงหาคม

EUR/USD การวิเคราะห์: การเคลื่อนไหวของราคายุโรถูกรูปแบบด้วยคลื่นขาขึ้นที่เริ่มขึ้นในเดือนธันวาคมปีที่แล้ว ในช่วงสองเดือนที่ผ่านมา มีส่วนของการปรับตัวที่พัฒนาในโครงสร้างนี้ ซึ่งเป็นลักษณะแบนเรียบ ส่วนขาขึ้นจากวันที่ 30 กรกฎาคมแสดงถึงศักยภาพการกลับตัวและอาจเป็นสัญญาณการเริ่มต้นของระยะสุดท้ายของคลื่นหากได้รับการยืนยัน คาดการณ์: มีแนวโน้มที่จะเคลื่อนไหวขึ้นอย่างต่อเนื่อง หลังจากที่มีแรงกดดันอาจเกิดบนโซนต้านทาน อาจมีโอกาสกลับตัวไปยังโซนสนับสนุน ช่วงการเคลื่อนไหวในสัปดาห์ที่คาดไว้จะอยู่ระหว่างโซนกลับตัวที่ใกล้เคียงที่สุด โซนกลับทิศทางที่เป็นไปได้

Isabel Clark 09:49 2025-08-04 UTC+2

การวิเคราะห์ GBP/USD ประจำวันที่ 1 สิงหาคม 2025

รูปแบบของคลื่นสำหรับ GBP/USD ยังคงชี้ให้เห็นถึงการก่อตัวของรูปแบบคลื่นแรงกระตุ้นที่มุ่งขึ้น รูปแบบคลื่นนี้มีความคล้ายคลึงกับ EUR/USD อย่างใกล้ชิด เนื่องจากเงินดอลลาร์ยังคงเป็นปัจจัยสำคัญทั่วทั้งกระดาน ความต้องการเงินดอลลาร์ลดลงในระยะกลางทั่วตลาด นำไปสู่พลวัตที่คล้ายกันในเครื่องมือต่างๆ ขณะนี้ ชุดคลื่นแก้ไขภายในคลื่น 4 ยังคงพัฒนา หากสมมติฐานนี้ยังคงมีอยู่ การลดลงของคู่นี้อาจสิ้นสุดลงในไม่ช้า

Chin Zhao 21:16 2025-08-01 UTC+2
หากไม่สะดวกคุยในตอนนี้
ระบุคำถามไว้ได้ใน แชท.
Widget callback
 

Dear visitor,

Your IP address shows that you are currently located in the USA. If you are a resident of the United States, you are prohibited from using the services of InstaFintech Group including online trading, online transfers, deposit/withdrawal of funds, etc.

If you think you are seeing this message by mistake and your location is not the US, kindly proceed to the website. Otherwise, you must leave the website in order to comply with government restrictions.

Why does your IP address show your location as the USA?

  • - you are using a VPN provided by a hosting company based in the United States;
  • - your IP does not have proper WHOIS records;
  • - an error occurred in the WHOIS geolocation database.

Please confirm whether you are a US resident or not by clicking the relevant button below. If you choose the wrong option, being a US resident, you will not be able to open an account with InstaForex anyway.

We are sorry for any inconvenience caused by this message.