

сила сигнала 1 из 5
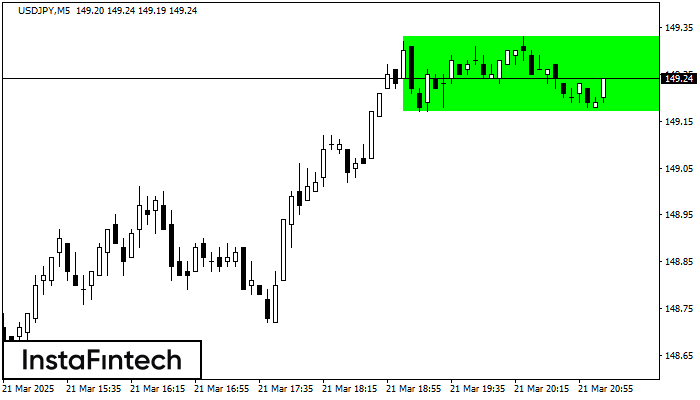
Сформирована фигура «Прямоугольник» на графике USDJPY M5. Тип фигуры: Продолжение тренда; Границы: Верхняя 149.33, Нижняя 149.17; Сигнал: позицию на покупку следует открывать выше верхней границы прямоугольника 149.33.
Таймфреймы М5 и М15 могут иметь больше ложных точек входа.
- Все
- Вымпел
- Голова и плечи
- Двойная вершина
- Прямоугольник
- Треугольник
- Тройная вершина
- Флаг
- Все
- #AAPL
- #AMZN
- #Bitcoin
- #EBAY
- #FB
- #GOOG
- #INTC
- #KO
- #MA
- #MCD
- #MSFT
- #NTDOY
- #PEP
- #TSLA
- #TWTR
- AUDCAD
- AUDCHF
- AUDJPY
- AUDUSD
- EURCAD
- EURCHF
- EURGBP
- EURJPY
- EURNZD
- EURRUB
- EURUSD
- GBPAUD
- GBPCHF
- GBPJPY
- GBPUSD
- GOLD
- NZDCAD
- NZDCHF
- NZDJPY
- NZDUSD
- SILVER
- USDCAD
- USDCHF
- USDJPY
- USDRUB
- Все
- M5
- M15
- M30
- H1
- D1
- Все
- Покупка
- Продажа
- Все
- 1
- 2
- 3
- 4
- 5
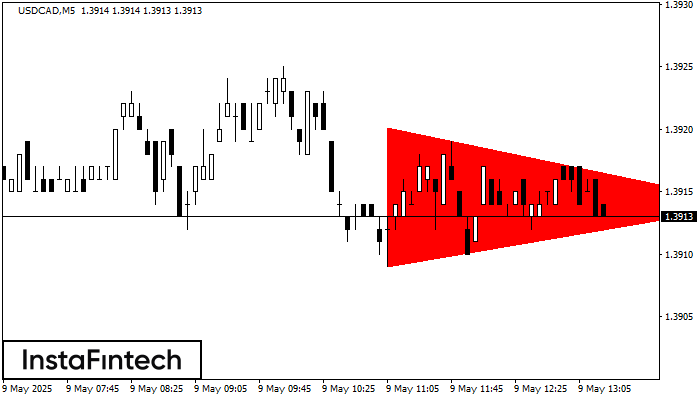
На графике USDCAD M5 сформировалась фигура «Медвежий симметричный треугольник». Характеристика фигуры: Нижняя граница 1.3909/1.3914; Верхняя граница 1.3920/1.3914; Проекция ширины фигуры -11 пунктов. Формирование фигуры «Медвежий симметричный треугольник» наиболее вероятным образом
Таймфреймы М5 и М15 могут иметь больше ложных точек входа.
Открыть график инструмента в новом окне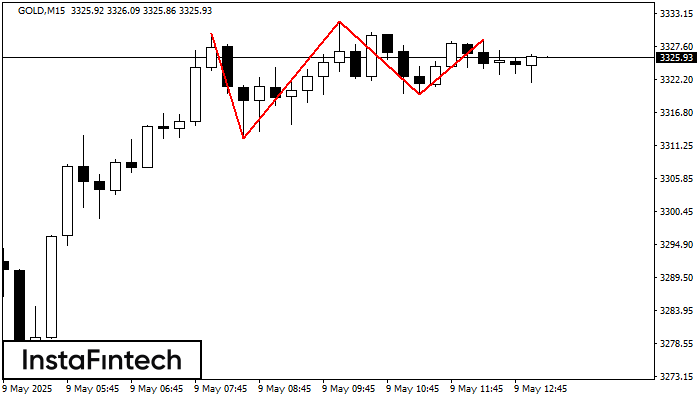
На графике GOLD M15 образовалась фигура «Тройная вершина». Данная фигура относится к типу разворотных и имеет характеристику: Верхняя граница 3329.82/3328.83; Нижняя граница 3312.44/3319.79; Ширина фигуры 1200 пунктов. Прогноз: В случае
Таймфреймы М5 и М15 могут иметь больше ложных точек входа.
Открыть график инструмента в новом окне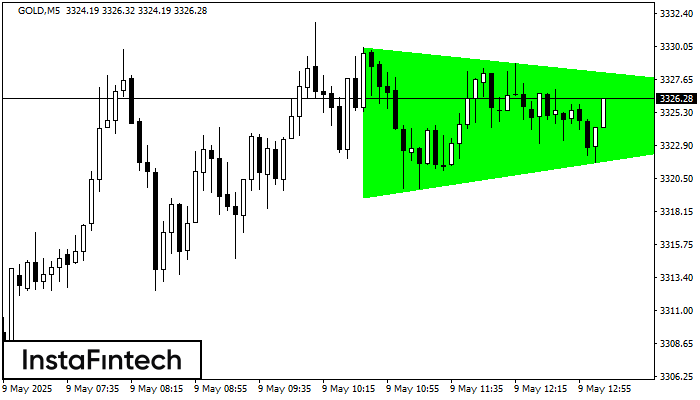
По GOLD на M5 сформировалась фигура «Бычий симметричный треугольник», которая сигнализирует нам о продолжении тенденции. Характеристика: Верхняя граница фигуры имеет координаты 3329.96/3325.57; Нижняя граница 3319.19/3325.57; Проекция ширины фигуры 1077 пунктов
Таймфреймы М5 и М15 могут иметь больше ложных точек входа.
Открыть график инструмента в новом окне


