


сила сигнала 1 из 5

По USDCHF на M5 сформировалась фигура «Бычий симметричный треугольник». Нижняя граница фигуры имеет координаты 0.8825/0.8830, при этом верхняя граница 0.8835/0.8830. Формирование фигуры «Бычий симметричный треугольник» наиболее вероятным образом свидетельствует о продолжении восходящего тренда. Это означает, что курс USDCHF, в случае срабатывания фигуры, пробьет верхнюю границу и направится к значению 0.8845.
Таймфреймы М5 и М15 могут иметь больше ложных точек входа.
Shuningdek ko'ring
- Все
- Вымпел
- Голова и плечи
- Двойная вершина
- Прямоугольник
- Треугольник
- Тройная вершина
- Флаг
- Все
- #AAPL
- #AMZN
- #Bitcoin
- #EBAY
- #FB
- #GOOG
- #INTC
- #KO
- #MA
- #MCD
- #MSFT
- #NTDOY
- #PEP
- #TSLA
- #TWTR
- AUDCAD
- AUDCHF
- AUDJPY
- AUDUSD
- EURCAD
- EURCHF
- EURGBP
- EURJPY
- EURNZD
- EURRUB
- EURUSD
- GBPAUD
- GBPCHF
- GBPJPY
- GBPUSD
- GOLD
- NZDCAD
- NZDCHF
- NZDJPY
- NZDUSD
- SILVER
- USDCAD
- USDCHF
- USDJPY
- USDRUB
- Все
- M5
- M15
- M30
- H1
- D1
- Все
- Покупка
- Продажа
- Все
- 1
- 2
- 3
- 4
- 5
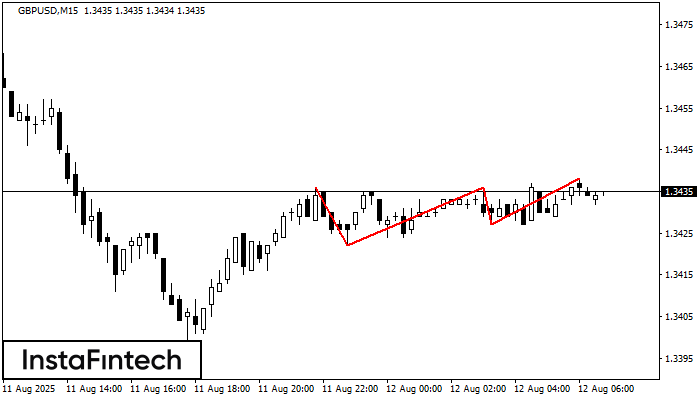
The Triple Top pattern has formed on the chart of the GBPUSD M15. Features of the pattern: borders have an ascending angle; the lower line of the pattern
The M5 and M15 time frames may have more false entry points.
Открыть график инструмента в новом окне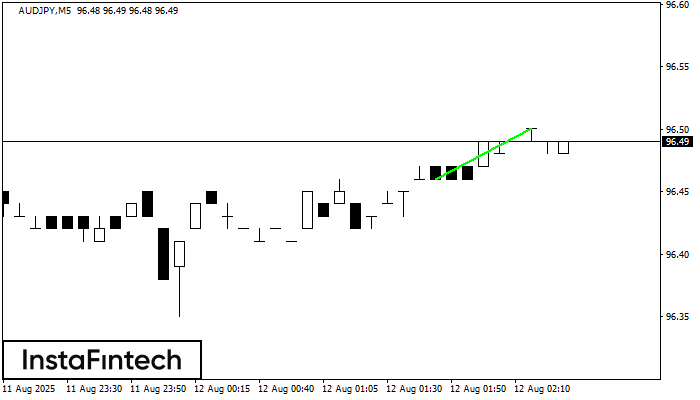
The Bullish Flag pattern which signals continuation of a trend has been formed on the chart AUDJPY M5. Forecast: if the price breaks above the pattern high at 96.50, then
The M5 and M15 time frames may have more false entry points.
Открыть график инструмента в новом окне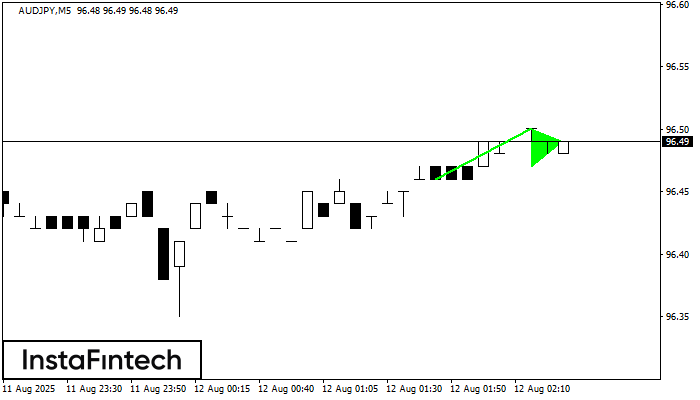
The Bullish pennant signal – Trading instrument AUDJPY M5, continuation pattern. Forecast: it is possible to set up a buy position above the pattern’s high of 96.50, with the prospect
The M5 and M15 time frames may have more false entry points.
Открыть график инструмента в новом окне


