


сила сигнала 1 из 5

По GBPAUD на M5 сформировалась фигура «Тройное дно». Характеристика: Нижняя граница фигуры имеет координаты 2.0912, при этом верхняя граница 2.0938/2.0931. Проекция ширины 20 пунктов. Формирование фигуры «Тройное дно» наиболее вероятным образом свидетельствует об изменении тренда с нисходящего на восходящий. Это означает, что в случае пробоя нижней границы 2.0912 курс, с наибольшей вероятностью, продолжит восходящее движение.
Таймфреймы М5 и М15 могут иметь больше ложных точек входа.
- Все
- Вымпел
- Голова и плечи
- Двойная вершина
- Прямоугольник
- Треугольник
- Тройная вершина
- Флаг
- Все
- #AAPL
- #AMZN
- #Bitcoin
- #EBAY
- #FB
- #GOOG
- #INTC
- #KO
- #MA
- #MCD
- #MSFT
- #NTDOY
- #PEP
- #TSLA
- #TWTR
- AUDCAD
- AUDCHF
- AUDJPY
- AUDUSD
- EURCAD
- EURCHF
- EURGBP
- EURJPY
- EURNZD
- EURRUB
- EURUSD
- GBPAUD
- GBPCHF
- GBPJPY
- GBPUSD
- GOLD
- NZDCAD
- NZDCHF
- NZDJPY
- NZDUSD
- SILVER
- USDCAD
- USDCHF
- USDJPY
- USDRUB
- Все
- M5
- M15
- M30
- H1
- D1
- Все
- Покупка
- Продажа
- Все
- 1
- 2
- 3
- 4
- 5
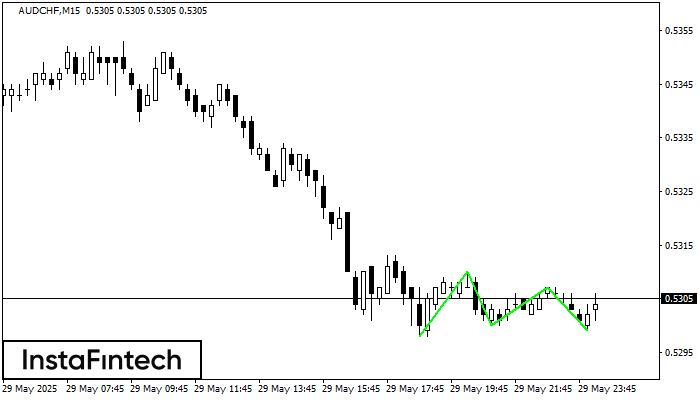
The Triple Bottom pattern has formed on the chart of AUDCHF M15. Features of the pattern: The lower line of the pattern has coordinates 0.5310 with the upper limit 0.5310/0.5307
The M5 and M15 time frames may have more false entry points.
Открыть график инструмента в новом окне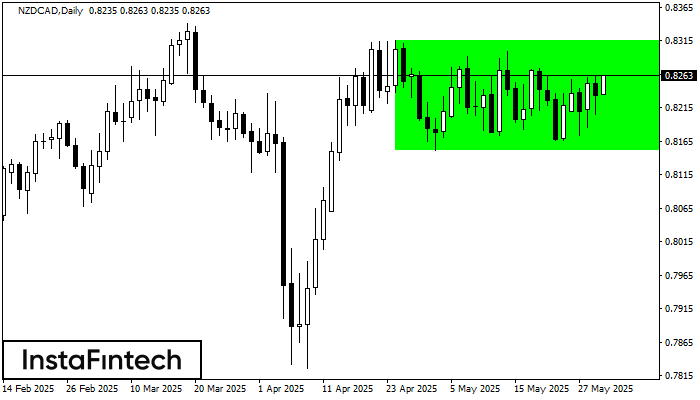
According to the chart of D1, NZDCAD formed the Bullish Rectangle. The pattern indicates a trend continuation. The upper border is 0.8316, the lower border is 0.8151. The signal means
Открыть график инструмента в новом окне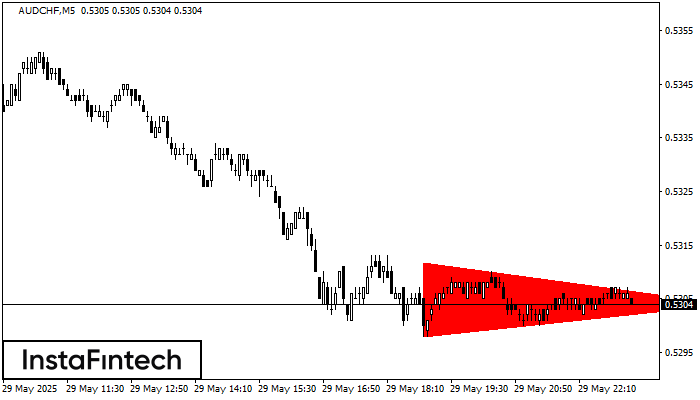
According to the chart of M5, AUDCHF formed the Bearish Symmetrical Triangle pattern. Trading recommendations: A breach of the lower border 0.5298 is likely to encourage a continuation
The M5 and M15 time frames may have more false entry points.
Открыть график инструмента в новом окне


