empty
31.10.2023 06:32 AM
EUR/USD and GBP/USD: Technical analysis for October 31

EUR/USD

This image is no longer relevant

Higher Timeframes

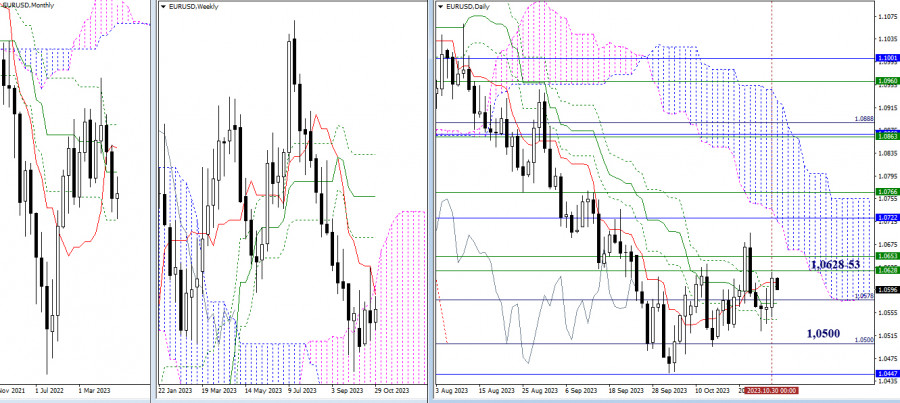
At the end of yesterday, judging by the mood and the shape of the daily candle, it can be said that the advantage during the day belonged to the bullish players. However, one day did not fundamentally change the situation. The main conclusions and expectations remain the same. For the bulls, it is now important to overcome the weekly resistances at 1.0628 – 1.0653 (weekly short-term trend + upper boundary of the weekly cloud). Next, attention will be on updating the high (1.0695) and testing the area of 1.0716-22 (lower boundary of the daily cloud + monthly medium-term trend). The current support and influence on the situation at the moment are provided by the levels of the daily Ichimoku cross (1.0609 – 1.0601 – 1.0572 – 1.0543). The subsequent bearish targets today retain their significance and are located at 1.0500 (daily target level) and 1.0447 (final level of the monthly Ichimoku cross).

This image is no longer relevant

H4 – H1

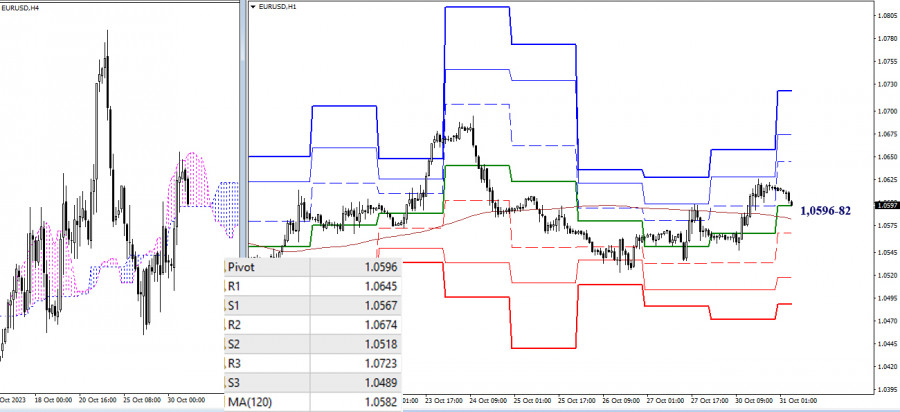
On the lower timeframes, bulls rose above the key levels, turning them into supports. However, they have not been able to reverse the movement yet. In case of further ascent, the next bullish targets within the day can be noted at 1.0645 – 1.0674 – 1.0723 (resistances of classic pivot points). A change in sentiment can happen very quickly now; it is enough for the bears to drop below the key levels located today at 1.0596 – 1.0582 (central pivot point + weekly long-term trend). The next intraday bearish targets are at 1.0567 – 1.0518 – 1.0489 (supports of classic pivot points).

***

GBP/USD

This image is no longer relevant

Higher Timeframes

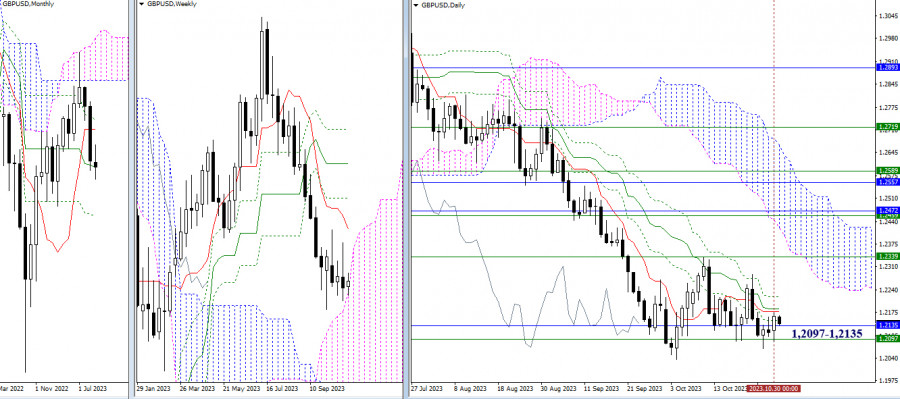
The pound continues to be influenced by the force of attraction of two significant levels in the area of 1.2097 – 1.2135 (upper boundary of the weekly cloud + monthly medium-term trend). Bearish players need an exit from the current zone of attraction and a reliable reversal of the downward trend through the update of the low (1.2036). For the bulls, it is important to eliminate the daily cross (1.2151 – 1.2178 – 1.2186 – 1.2221) and consolidate above the weekly short-term trend (1.2339).

This image is no longer relevant

H4 – H1

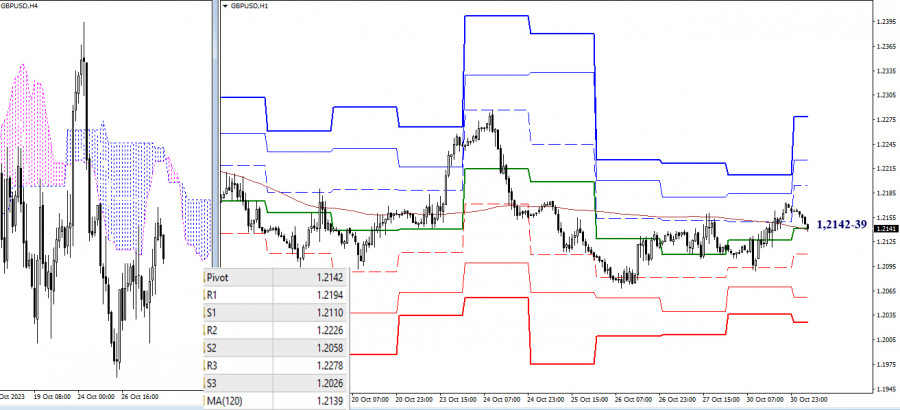
On the lower timeframes, the key levels today have come together in the area of 1.2139 – 1.2142 (weekly long-term trend + central pivot point of the day). Interacting with the key levels, the market seems to be in a point of balance and uncertainty. Trading above the key levels gives the advantage to strengthening bullish sentiments. The resistances of classic pivot points (1.2194 – 1.2296 – 1.2278) can serve as targets for the development of an intraday rise. Trading below the key levels may create conditions for bearish activity and a decline. Intraday bearish targets are at the support levels of classic pivot points (1.2110 – 1.2058 – 1.2026).

***

The technical analysis of the situation uses:

Higher timeframes - Ichimoku Kinko Hyo (9.26.52) + Fibo Kijun levels

Lower timeframes - H1 - Pivot Points (classic) + Moving Average 120 (weekly long-term trend)

Evangelos Poulakis,
Chuyên gia phân tích của InstaForex
© 2007-2025
Summary
Urgency
Analytic
Zhizhko Nadezhda
Start trade
Kiếm lợi nhuận từ những biến đổi giá của tiền điện tử với InstaForex.
Tải MetaTrader 4 và mở giao dịch đầu tiên của bạn.
  • Grand Choice
    Contest by
    InstaForex
    InstaForex always strives to help you
    fulfill your biggest dreams.
    THAM GIA CUỘC THI

Các bài báo được đề xuất

Dự báo Forex 18/07/2025: EUR/USD, GBP/USD, USD/JPY, Dầu, Ethereum và Bitcoin

Các liên kết hữu ích: Các bài viết khác của tôi có sẵn trong phần này Khóa học InstaForex dành cho người mới bắt đầu Phân Tích Phổ Biến

Sebastian Seliga 14:51 2025-07-18 UTC+2

GBP/USD. Tổng Quan Hàng Ngày vào ngày 18 tháng 7, 2025

Vào thứ Năm, cặp tiền này đã di chuyển xuống dưới và gần như đã kiểm tra mức fractal thấp hơn tại 1.3369 (đường màu vàng nét đứt)

Stefan Doll 13:14 2025-07-18 UTC+2

XAU/USD. Phân tích và Dự báo

Hôm nay, giá vàng đang tăng. Sự biến động giá gần đây trong một phạm vi được quan sát kể từ đầu tháng này cho thấy sự hình thành

Irina Yanina 13:06 2025-07-18 UTC+2

EUR/USD. Tổng quan hàng ngày vào ngày 18 tháng 7, 2025

Vào thứ Năm, cặp tiền này đã di chuyển xuống mức thoái lui 61.8% tại 1.1650 (đường gạch đỏ), sau đó đảo chiều tăng lên, đóng nến hàng ngày

Stefan Doll 12:49 2025-07-18 UTC+2

Dự báo cho EUR/USD vào ngày 18 tháng 7 năm 2025

Vào thứ Năm, cặp tiền tệ EUR/USD đã trở lại mức điều chỉnh 100,0% tại 1,1574 và bật lên khỏi mức này lần thứ hai liên tiếp. Điều

Samir Klishi 12:16 2025-07-18 UTC+2

Dự báo cho GBP/USD vào ngày 18 tháng 7, 2025

Trên biểu đồ hàng giờ, cặp GBP/USD vào ngày thứ Năm đã trở về vùng hỗ trợ 1.3357–1.3371 và bật lên khỏi vùng này một lần nữa. Điều

Samir Klishi 11:49 2025-07-18 UTC+2

Tín hiệu giao dịch cho EUR/USD từ ngày 18-21 tháng 7, 2025: mua trên 1.1596 (200 EMA - 7/8 Murray)

Với việc chỉ báo eagle đang cho thấy tiềm năng phục hồi cho đồng euro, chúng tôi sẽ tìm kiếm cơ hội mua vào mỗi khi đồng euro quay

Dimitrios Zappas 08:22 2025-07-18 UTC+2

Tín hiệu giao dịch cho BITCOIN từ ngày 18-21 tháng 7, 2025: mua trên mức $118,000 (6/8 Murray - 21 SMA)

Nếu Bitcoin thực hiện điều chỉnh kỹ thuật về mức hỗ trợ 118.750 hoặc kênh xu hướng tăng thứ cấp quanh khoảng 118.200 trong vài giờ tới, đây sẽ được

Dimitrios Zappas 08:22 2025-07-18 UTC+2

Tín hiệu giao dịch cho VÀNG (XAU/USD) từ ngày 18-21 tháng 7, 2025: mua trên mức $3,330 (21 SMA - 5/8 Murray)

Ngược lại, nếu vàng giảm xuống dưới mức 3,320 và phá vỡ kênh xu hướng tăng, chúng ta có thể kỳ vọng một sự đảo chiều xu hướng

Dimitrios Zappas 07:23 2025-07-18 UTC+2

Nếu XAU/USD thành công trong việc phá vỡ và đóng cửa dưới mức Pivot, nó có khả năng tiếp tục giảm xuống mức hỗ trợ tiếp theo, Thứ Sáu, ngày 18 tháng 7 năm 2025.

XAU/USD – Thứ Sáu, Ngày 18 Tháng 7, 2025. Khả năng XAU/USD suy yếu vẫn tiếp tục, được thể hiện qua EMA (50) nằm dưới EMA (200) và RSI (14)

Arief Makmur 07:02 2025-07-18 UTC+2
Không thể nói chuyện ngay bây giờ?
Đặt câu hỏi của bạn trong phần trò chuyện.
Widget callback
 

Dear visitor,

Your IP address shows that you are currently located in the USA. If you are a resident of the United States, you are prohibited from using the services of InstaFintech Group including online trading, online transfers, deposit/withdrawal of funds, etc.

If you think you are seeing this message by mistake and your location is not the US, kindly proceed to the website. Otherwise, you must leave the website in order to comply with government restrictions.

Why does your IP address show your location as the USA?

  • - you are using a VPN provided by a hosting company based in the United States;
  • - your IP does not have proper WHOIS records;
  • - an error occurred in the WHOIS geolocation database.

Please confirm whether you are a US resident or not by clicking the relevant button below. If you choose the wrong option, being a US resident, you will not be able to open an account with InstaForex anyway.

We are sorry for any inconvenience caused by this message.