

signal strength 4 of 5
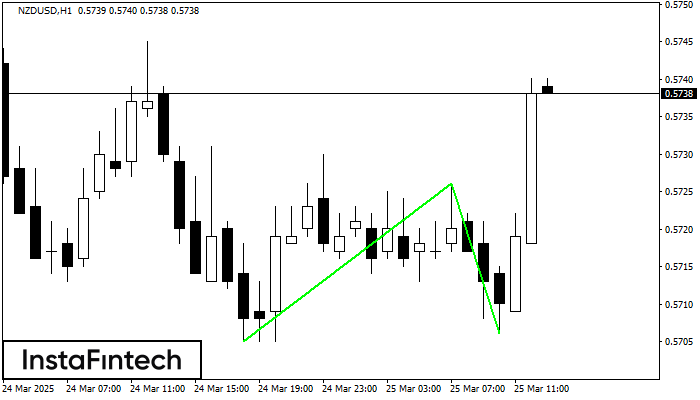
The Double Bottom pattern has been formed on NZDUSD H1. Characteristics: the support level 0.5705; the resistance level 0.5726; the width of the pattern 21 points. If the resistance level is broken, a change in the trend can be predicted with the first target point lying at the distance of 20 points.
- All
- Double Top
- Flag
- Head and Shoulders
- Pennant
- Rectangle
- Triangle
- Triple top
- All
- #AAPL
- #AMZN
- #Bitcoin
- #EBAY
- #FB
- #GOOG
- #INTC
- #KO
- #MA
- #MCD
- #MSFT
- #NTDOY
- #PEP
- #TSLA
- #TWTR
- AUDCAD
- AUDCHF
- AUDJPY
- AUDUSD
- EURCAD
- EURCHF
- EURGBP
- EURJPY
- EURNZD
- EURRUB
- EURUSD
- GBPAUD
- GBPCHF
- GBPJPY
- GBPUSD
- GOLD
- NZDCAD
- NZDCHF
- NZDJPY
- NZDUSD
- SILVER
- USDCAD
- USDCHF
- USDJPY
- USDRUB
- All
- M5
- M15
- M30
- H1
- D1
- All
- Buy
- Sale
- All
- 1
- 2
- 3
- 4
- 5
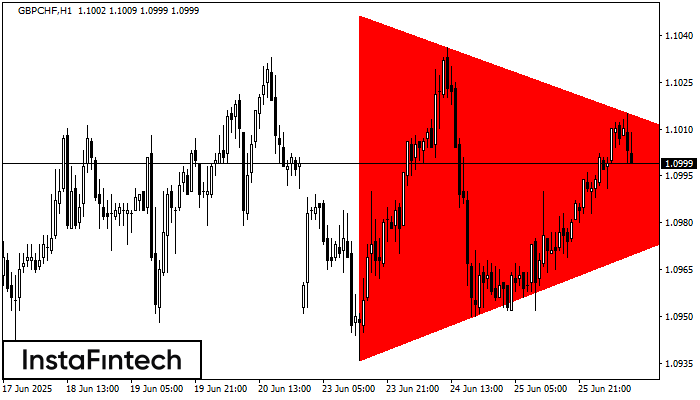
According to the chart of H1, GBPCHF formed the Bearish Symmetrical Triangle pattern. Description: The lower border is 1.0936/1.0993 and upper border is 1.1046/1.0993. The pattern width is measured
Open chart in a new window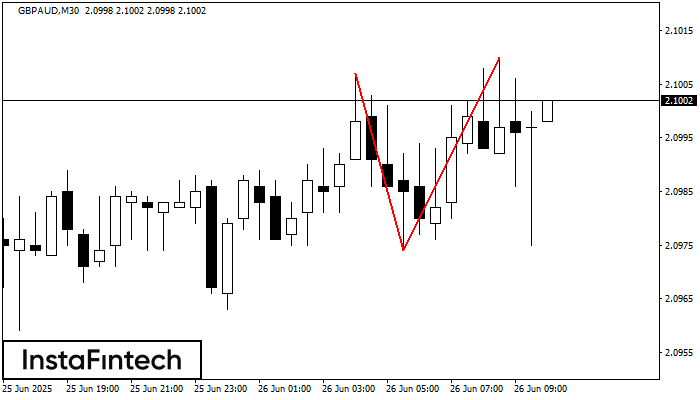
On the chart of GBPAUD M30 the Double Top reversal pattern has been formed. Characteristics: the upper boundary 2.1010; the lower boundary 2.0974; the width of the pattern 36 points
Open chart in a new window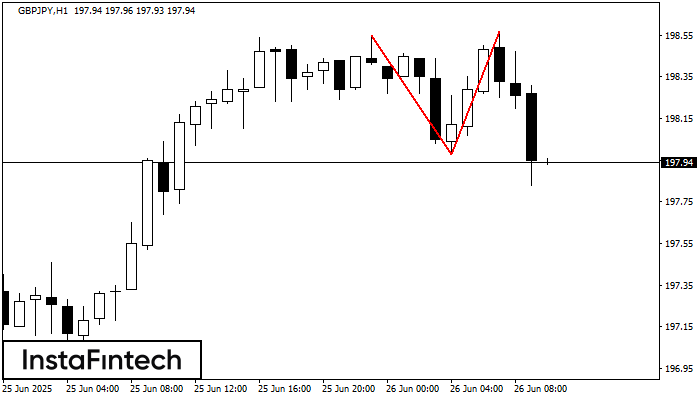
The Double Top pattern has been formed on GBPJPY H1. It signals that the trend has been changed from upwards to downwards. Probably, if the base of the pattern 197.98
Open chart in a new window


