

signal strength 1 of 5
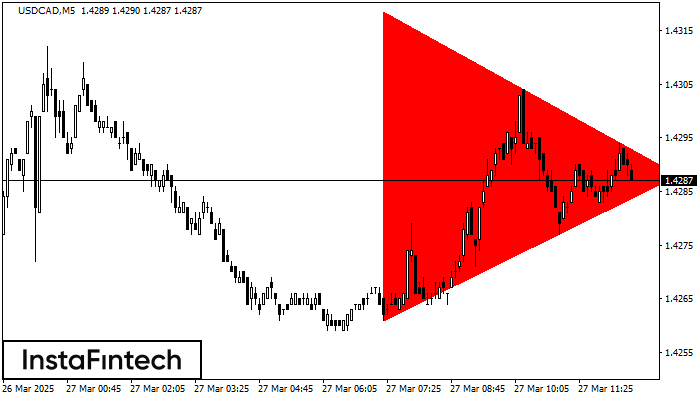
According to the chart of M5, USDCAD formed the Bearish Symmetrical Triangle pattern. This pattern signals a further downward trend in case the lower border 1.4261 is breached. Here, a hypothetical profit will equal the width of the available pattern that is -58 pips.
The M5 and M15 time frames may have more false entry points.
Xem thêm
- All
- Double Top
- Flag
- Head and Shoulders
- Pennant
- Rectangle
- Triangle
- Triple top
- All
- #AAPL
- #AMZN
- #Bitcoin
- #EBAY
- #FB
- #GOOG
- #INTC
- #KO
- #MA
- #MCD
- #MSFT
- #NTDOY
- #PEP
- #TSLA
- #TWTR
- AUDCAD
- AUDCHF
- AUDJPY
- AUDUSD
- EURCAD
- EURCHF
- EURGBP
- EURJPY
- EURNZD
- EURRUB
- EURUSD
- GBPAUD
- GBPCHF
- GBPJPY
- GBPUSD
- GOLD
- NZDCAD
- NZDCHF
- NZDJPY
- NZDUSD
- SILVER
- USDCAD
- USDCHF
- USDJPY
- USDRUB
- All
- M5
- M15
- M30
- H1
- D1
- All
- Buy
- Sale
- All
- 1
- 2
- 3
- 4
- 5
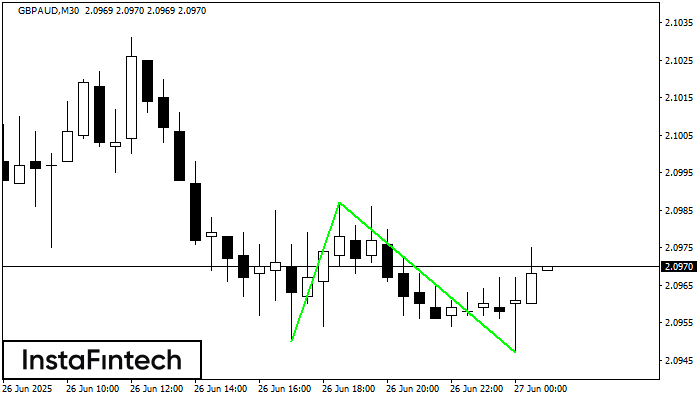
Mô hình Đáy đôi đã được hình thành trên GBPAUD M30. Sự hình thành này báo hiệu sự đảo chiều của xu hướng từ dưới lên trên. Tín hiệu
Open chart in a new window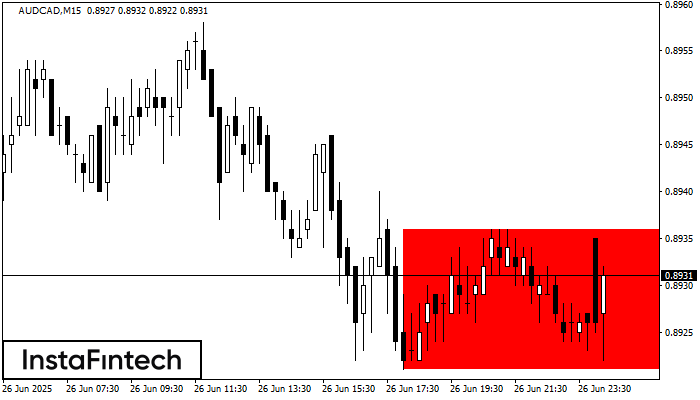
Theo biểu đồ của M15, AUDCAD đã hình thành Hình chữ nhật giảm, cái mà là mô hình của sự tiếp tục xu hướng. Mô hình được chứa trong
Khung thời gian M5 và M15 có thể có nhiều điểm vào lệnh sai hơn.
Open chart in a new window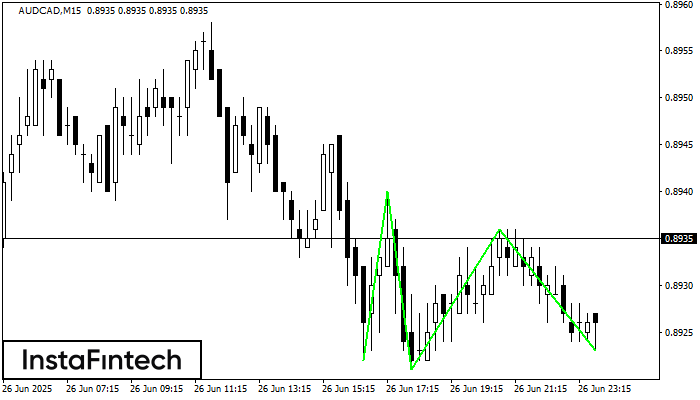
Mô hình Đáy ba đã được hình thành trên biểu đồ của AUDCAD M15. Các tính năng của mô hình: Đường dưới của mô hình có tọa độ 0.8940
Khung thời gian M5 và M15 có thể có nhiều điểm vào lệnh sai hơn.
Open chart in a new window


