

signal strength 2 of 5
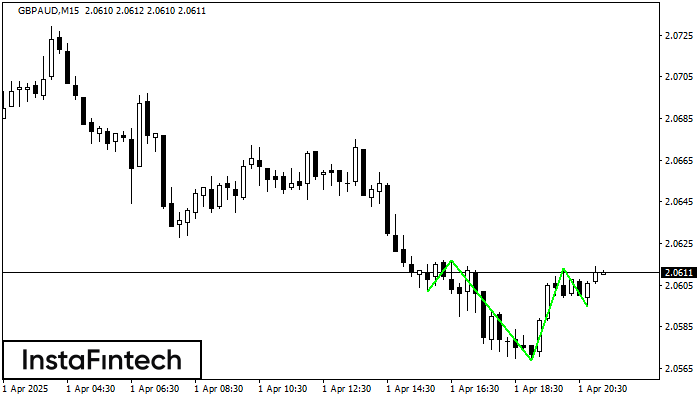
According to the chart of M15, GBPAUD formed the Inverse Head and Shoulder pattern. The Head’s top is set at 2.0613 while the median line of the Neck is found at 2.0569/2.0595. The formation of the Inverse Head and Shoulder pattern evidently signals a reversal of the downward trend. In other words, in case the scenario comes true, the price of GBPAUD will go towards 2.0635
The M5 and M15 time frames may have more false entry points.
Xem thêm
- All
- Double Top
- Flag
- Head and Shoulders
- Pennant
- Rectangle
- Triangle
- Triple top
- All
- #AAPL
- #AMZN
- #Bitcoin
- #EBAY
- #FB
- #GOOG
- #INTC
- #KO
- #MA
- #MCD
- #MSFT
- #NTDOY
- #PEP
- #TSLA
- #TWTR
- AUDCAD
- AUDCHF
- AUDJPY
- AUDUSD
- EURCAD
- EURCHF
- EURGBP
- EURJPY
- EURNZD
- EURRUB
- EURUSD
- GBPAUD
- GBPCHF
- GBPJPY
- GBPUSD
- GOLD
- NZDCAD
- NZDCHF
- NZDJPY
- NZDUSD
- SILVER
- USDCAD
- USDCHF
- USDJPY
- USDRUB
- All
- M5
- M15
- M30
- H1
- D1
- All
- Buy
- Sale
- All
- 1
- 2
- 3
- 4
- 5
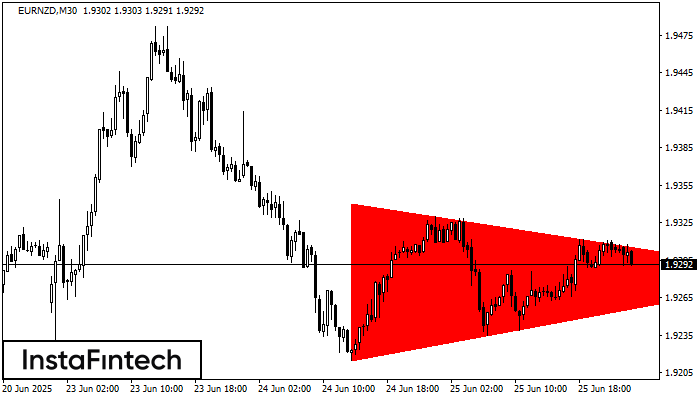
Theo biểu đồ của M30, EURNZD đã hình thành mô hình Tam giác Cân Giảm. Khuyến nghị giao dịch: Việc vi phạm biên giới thấp hơn 1.9215 có khả năng
Open chart in a new window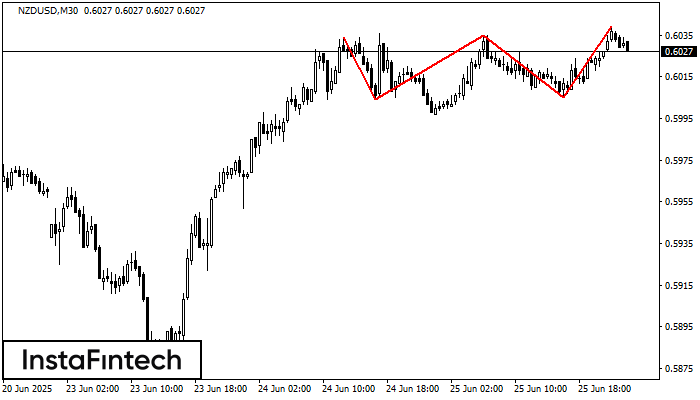
Mô hình Đỉnh ba đã được hình thành trên biểu đồ của công cụ giao dịch NZDUSD M30. Đó là mô hình đảo chiều có các đặc điểm
Open chart in a new window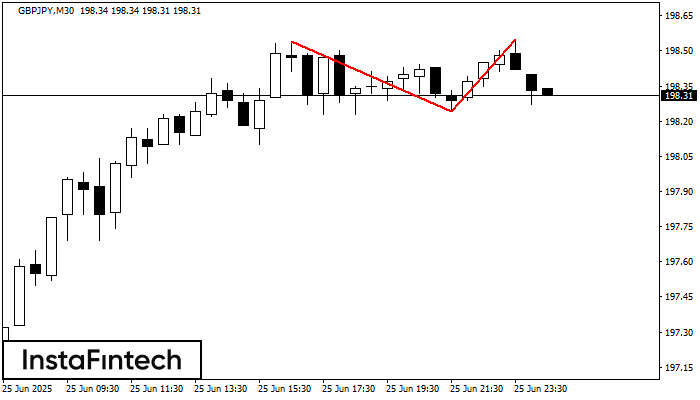
Trên biểu đồ GBPJPY M30, mô hình đảo chiều Đỉnh đôi đã được hình thành. Đặc điểm: ranh giới trên ở 198.55; ranh giới dưới ở 198.24; chiều rộng
Open chart in a new window


